Optimizing Ambulance Journey Times for Stroke and Trauma Patients in London
190 likes | 304 Vues
This project, led by healthcare analysts and project managers, utilized data from the London Ambulance Service (LAS) to optimize journey times for stroke and major trauma patients. Over 4 million records from the past three years were analyzed to compare journey speeds influenced by time of day and day of week. By using MapInfo Drivetime, a model of road networks, we estimated travel areas around hospitals to enhance planning. Findings indicate that blue-light ambulance journeys are significantly faster than standard journeys, critical for effective patient care.

Optimizing Ambulance Journey Times for Stroke and Trauma Patients in London
E N D
Presentation Transcript
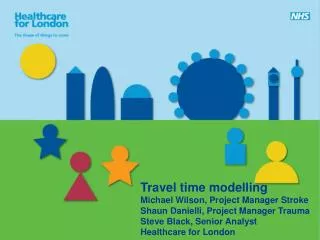
Travel time modelling Michael Wilson, Project Manager Stroke Shaun Danielli, Project Manager Trauma Steve Black, Senior Analyst Healthcare for London
Data Source – London Ambulance Service • For both Stroke and Major Trauma, it was decided that London Ambulance Service (LAS) journeys should be used for planning purposes and design of the systems. • This is on the basis that the clear majority of stroke and major trauma patients are delivered by ambulance rather than private transport. . • For Major Trauma the air ambulance was not used as part of the journey information because of limitations on the use of helicopter in London. • The Projects sourced the details of every ambulance journey in London in the last 3 years (Jan 2005 to March 2008), roughly 4 million records.
Data Source – London Ambulance Service (cont.) • A comparison was undertaken to assess whether certain types of journeys are faster than others and the extent to which journey speed is influenced by time of day, or day of week. • For journeys relevant to Trauma and Stroke, where protocols will mostly involve bypassing nearest hospitals and taking patients directly to specialist centres, the dataset is not as rich. • This is because most ambulance journeys currently go to the nearest hospital, which is often less than 15 minutes away and as such there are few long journeys in the dataset.
Data Source – London Ambulance Service (cont.) • It is therefore not possible to assess proposed journey times for the new model of care (taking patients to the most appropriate hospital, rather than the nearest) with actual journey times alone.
Mapinfo Drivetime • MapInfo Drivetime was used to estimate travel areas (or isochrones) around each candidate hospital. • Mapinfo’s Drivetime contains a model of the entire UK road network with associated average speeds. The model allows outlines of equal journey times around specified locations (known as isochrones) to be generated. • This has been used by, for example, by the Department of Health in understanding hospital coverage. This and similar products are widely used by delivery companies for route planning. • These isochrones assume all roads are available for travel and that the fastest routes are taken.
Mapinfo Drivetime (cont.) • While the results of travel time analysis from Drivetime are good they are based on average road speeds across the day for actual journeys (which includes rush hour, but also the less busy times). • Analysis of the effects of rush hour has been made from Transport for London (TfL) data and ambulance data. • This has enabled estimated comparison between rush hour and non rush hour journeys (detailed on next two slides). • Road speed is the best overall metric for estimating incident and population “coverage” within a defined time period. Therefore further adjustment, for when ambulances are making blue-light journeys; as they travel faster than average road speed, is required.
Estimation of LAS journey times Both LAS and Mapinfo Drivetime information was used to create a combined view of bluelight ambulance journeys from standard road journeys. To estimate how much faster bluelight journeys are compared to similar non-bluelight journeys we compared 100,000 bluelight journeys versus 2 million other urgent ambulance journeys.
Estimation of LAS journey times (cont.) • This gave an estimate that, averaged over all journeys, bluelight ambulance journeys take about 1/3 less time. • Using this analysis, calculations were then made of coverage areas, by population and incident, within different timeframes.
LAS Agreement • Travel time conclusions have been discussed with LAS and their analysts. • LAS have agreed with the travel bandings for London i.e. with different combinations of hospital sites, what areas of London are within 30 and 45 minute bluelight journeys. • The conclusions are also consistent with the actual experiences of the LAS arising from the reconfiguration of cardiac services across London.
Points to consider when using the analysis • A detailed analysis of travel times at different times of day could not be carried out. • Analysis of the LAS travel times shows the time taken by bluelight ambulances is reasonably consistent across the day, in comparison to non-blue light journeys which lengthen considerably during peak traffic times (see below).
Points to consider when using the analysis (cont.) • The analysis cannot take into account specific localised transport disruptions, but the LAS dataset covers a long period of time and typical traffic disruptions in London are already accounted for. • Also, ambulance crews use their experience to make routing decisions to minimise the impact of specific disruptions. • Major incidents, such as the 7/7 bombings are included in our analysis in terms of the journey times records. • In such incidents however, the Major Incident Plan would be activated including the closure of major roads to traffic.
Stroke: Clinically driven 30 minute journey time The key for stroke is that patients receive treatment within 3 hours from the onset of a stroke. The 30 minute journey from scene to HASU is part of this 3 hour window: The reason for this 3 hour window is that for thrombolysis (clot busting drug) to be most effective it must be administered no more than 3 hours from the onset of a stroke. To ensure the best clinical outcomes, patients should receive specialist treatment as soon as possible.
Major Trauma: 30 minute planning figure • The important factor for major trauma patients is that the time taken to definitive treatment is as short as possible. • Due to the complexity of managing major trauma patients, e.g. the length of time at scene varies by patient, a target time from injury to treatment has not been set. • A journey time of 30 minutes was used as a planning figure for system design to allow differentiation between configurations. • There is no clinical evidence that a 30 minute journey time is better than a 45 minute time in terms of improving outcomes. 30 minutes is used in Victoria, Australia but other trauma systems in parts of the US use 45 minutes. • The preferred major trauma centre option of Royal London, King’s, St George’s and St Mary’s covers 98.8% of all major trauma incidents within 30 minutes, and all of London with 40 minutes (see map below).
Attachment: London Ambulance Service journey times to heart attack centres 07-08