Principal Components Analysis (PCA)
60 likes | 186 Vues
This presentation by Don Fussell from the University of Texas at Austin covers Principal Components Analysis (PCA), a crucial method in dimensionality reduction used in advanced image synthesis. It outlines the goals of PCA, including how to identify the principal components that maximize data variance among a large set of variables. The step-by-step methodology includes mean centering, calculating the covariance matrix, and performing eigendecomposition to extract the relevant eigenvectors. By retaining only the most significant dimensions, PCA compresses data while preserving important information.

Principal Components Analysis (PCA)
E N D
Presentation Transcript
Principal Components Analysis (PCA) University of Texas at Austin CS395T - Advanced Image Synthesis Spring 2007 Don Fussell
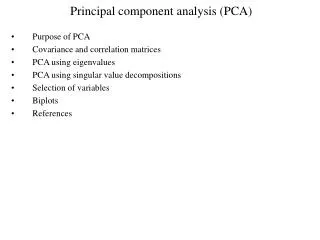
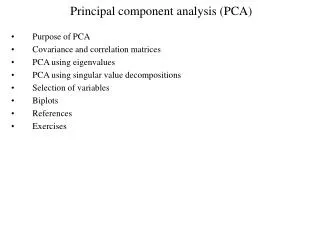
PCA Goals • Given • N “experiments” each determining a set of values for M data variables, where M is large • Find • The “best” set of L variables, L < M, that describe this data • “Best” means the new variables will be the L dimensions of greatest data variance, in order • Thus, we reduce the dimensionality of the data, retaining the most important information about how the data varies and throwing away the rest. This is a kind of compression, but clearly not the only kind (see e.g. DCT) University of Texas at Austin CS395T - Advanced Image Synthesis Spring 2007 Don Fussell
Overview of Method • Given mxn input matrix X (recall n observations of each of m variables) • Calculate the empirical mean a • Create a matrix of deviations from the mean (B) by subtracting a from X • Find the covariance matrix C of B • Find the eigenvector matrix E and the eigenvalue diagonal matrix D of C • Sort the columns of E and D in decreasing eigenvalue order • Pick the first L columns of (sorted) E to make the l xn matrix K • Create output matrix Y = KTB (note: really adjoint, not transpose, in general) University of Texas at Austin CS395T - Advanced Image Synthesis Spring 2007 Don Fussell
Detailed Steps - mean centering • Often just assumed wlg in descriptions of this method • Compute the average of each row • Subtract the averages from each data element University of Texas at Austin CS395T - Advanced Image Synthesis Spring 2007 Don Fussell
Detailed steps - covariance • Compute • Covariance • Measure of independence of pairs of variables • If independent then University of Texas at Austin CS395T - Advanced Image Synthesis Spring 2007 Don Fussell
Detailed steps - eigendecomposition • Compute matrix E of eigenvectors and D of eigenvalues s.t. • See spectral theorem of linear algebra • This is widely available in math packages University of Texas at Austin CS395T - Advanced Image Synthesis Spring 2007 Don Fussell