Understanding Demand: Key Concepts, Shifters, and the Law of Demand
This chapter explores the fundamentals of demand in microeconomics, including the individual demand curve, the law of demand, and factors that influence demand. It highlights how price changes affect quantity demanded and discusses demand shifters like consumer income and preferences. Additionally, it covers concepts like marginal utility and diminishing marginal utility, providing practical examples to illustrate these theories. By mastering these concepts, readers can gain insights into consumer behavior and market dynamics.


Understanding Demand: Key Concepts, Shifters, and the Law of Demand
E N D
Presentation Transcript
Demand Chapter 4
Is your buzzer working? • Yes • No
Chapter Essential Questions 4.1 EQ: What does the downward slope of the demand curve represent? 4.2 EQ: What are our 5 demand shifters? 4.3 EQ: How do we measure total expenditures?
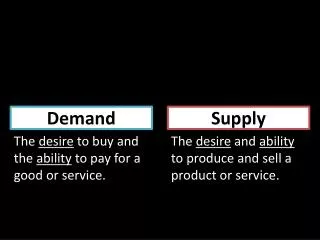
I. An introduction to Demand 1. Demand: the desire, ability, and willingness to buy a product. i. Demand is a microeconomic concept. *Microeconomic: Area of economics that deals with behavior and decision making by small units.
A. An Individual demand curve illustrates how the quantity that a person will demand varies depending on the price of the good or service. B. Economists analyze demand by listing prices and desired quantities in a demand schedule (chart). When the demand data is graphed, it forms a demand curve with a downward slope.
15 You can illustrate a demand curve on a demand schedule. • True • False
Example of an Individual Demand Schedule 1. Turn to page 90. Figure 4.1 A. Panel A shows amount of product that a consumer would be willing to purchase. Panel A is known as a : demand schedule
Panel A Information 2. Larry would not buy a CD for: $25.00 or $35.00 a. He will purchase: 1 @ $20 piece – 3 @ $15 – 5 @ $10 – 8 @ $5 b. Therefore Larry is… Willing to buy more units as the price gets lower.
Individual Demand Curve B. Panel B is called the demand curve. i. A graph showing the quantity demanded at each and every price that might prevail in the market. *A Schedule and a curve show the same information. Schedule=Chart Curve=Graph
Individual Question Demand Illustrated: • You are opening a bike repair shop. • Begin: 1. Know where the demand is. Where? A location with a lot of bike riders-few repair shops. 2. Measure demand: How? Check consumer data and determine demand from data. Check consumer reactions to prices.
II. The Law of Demand A. The Law of Demand states that the quantity demanded of a good or service varies inversely with its price. B. Easier definition: • Price goes up=quantity demand goes down • Price goes down=quantity demand goes up
Market Demand Curve C. Market Demand Curve: the demand curve that shows the quantities demanded by everyone who is interested in purchasing the product. i. Turn to page 92. Figure 4.2. ii. Add together number of CD’s between Larry and Curly then plot them. *Notice demand curves slope downward
15 If the price of an item goes up, demand goes… • Up • Nowhere • Down
III. Demand and Marginal Utility A. Marginal Utility: the extra usefulness or satisfaction a person gets from acquiring or using one or more unit of a product. i. The reason we buy things is because we feel the product is useful and will give us satisfaction.
15 Will there ever be a point where marginal utility begins to decrease? • Yes • No
Diminishing Marginal Utility B. Diminishing Marginal Utility: extra satisfaction we get from using additional quantities of the product begin to diminish. Example: You’re thirsty so you buy a cola. You get the most satisfaction from that first cola. You get less satisfaction from second, third, fourth cola—therefore you are willing to pay less.
4.1 EQ What does the downward slope of the demand curve represent? With a higher price of a product, people will demand less of that product. As the price lowers, the demand for the product increases.
I. Change in the quantity demanded. A. Change in Quantity Demand: movement along the demand curve that shows a change in the quantity if the product purchased in response to a change in price. Change in Quantity Demand A B
The Income/Substitution Effect B. Income Effect: as a prices drop, consumers are left with extra real income. i. Example: A sale on CD’s gives consumers extra money in real income to spend on another product. C. Substitution Effect: a price can cause consumers to substitute one product for another similar, but cheaper item. i. Example: Buy CD instead of going to concert. You are substituting for something cheaper.
15 Seconds Remaining A change in price will make the demand curve shift left or right. • True • False
II. Change in Demand A. A change in demand is when people buy different amounts of the product at the same prices. B. A Demand curve changes for several reasons. i. Changes in income, tastes, substitutes, compliments, expectations, number of consumers.
To the Left: Decrease To the Right: Increase New Demand Old Demand
Change in Demand 1. Consumer Income: If society’s income rises people will buy more. Demand curve shifts to the RIGHT. 2. Consumer Tastes: Good advertisement – Popularity increases. People buy more. Demand curve shifts to the RIGHT. a. Tired of a product: Shifts to the LEFT. 3. Substitutes: change in price of related products. Ex: If Margarine prices rise people will begin to buy Butter.
14 Which of the following is an example of a substitute goods? • Peanut Butter and Jelly • Sugar and Splenda • Eggs and Bacon
…continued 4. Complements: use of one product increases use of the other. Ex: Cars help aid the demand for Gas. 5. Number of buyers: if something occurs where the number of buyers drop unexpectedly, so will the demand for consumer products.
Discussion Question Change in Expectations Think back to early 90’s with hammer pants, Reebok pumps, and fanny packs. Company announces new tech breakthrough called a DVD. What happens to VCRs? People excited and stop buying VHS. Demand curve shifts to the left for VHS. (Decreases)
4.2 EQ What are our 5 demand shifters? 1. Consumer Income 2. Consumer taste 3. Substitutes 4. Compliments 5. Number of Consumers
Elasticity of Demand A. Elasticity measures how sensitive consumers are to price changes. B. Demand is elastic when a change in price causes a large change in demand. C. Demand is inelastic when a change in price causes a small change in demand. D. Demand is unit elastic when a change in price causes a proportional change in demand.
15 Demand is elastic when a change in price causes a • Large change in demand • Small change in demand • Proportional change in demand
Example: Elastic Demand Given change in price causes a relatively larger change in quantity demanded Turn to page 103. Figure 4.5. Panel A. 1. Point A Point B declines $1, but quantity doubles from 2 units to 4. A: Since the percentage change in quantity was higher than change in price, Point A to Point B is elastic. Ex: Fruits and Vegetables. Prices low in summer, consumers increase amount they purchase. Prices higher in winter, buy less.
Example: Inelastic Demand A given change in price causes a relatively smaller change in the quantity demanded. 2. Look at Panel B. *Point A Point B declines $1. This time it only increases from 2 to 2 ½. Ex: Table salt. If price increases or decreases, quantity will still be around the same. People don’t splurge on salt. They just need it.
E. How do I know? 1. If the two points on a demand curve move in opposite directions they are elastic. i. It stretches. Elastic rubber band! 2. If two points move closer together it is inelastic. i. It does not stretch. No elastic!
15 Demand is unit elastic when a change in price causes a proportional change in demand • True • False
Example: Unit Elastic Demand A given change in price causes a proportional change in quantity demanded. Easy definition: percent change in quantity roughly equals percent change in price. 1. Look at Panel C. i. Point A Point B declines $1. Quantity declines 1 unit as well.
II. Total Expenditures Test A. Total Expenditures: the amount that consumers spend on a product at a particular price. Also known as the Total Expenditure Test Price time Quantity demanded equals total expenditures. P x Qd = TE Look at Panel A,B,C for example
15 When the extra satisfaction we get from using additional quantities of the product begin to diminish we call it: • Shrinking utility • Depleting marginal utility • Diminishing returns • Diminishing marginal utility
Three Results B. 3 things can happen when changing the prices. 1. When price drops and quantity increases it is ELASTIC! (Total Expenditures go up) 2. When price drops increase is so small that the total expenditures declines. This is INELASTIC! 3. Total Expenditures remain unchanged when price decreases. This is UNIT ELASTIC!
What's the point?Elasticity and Profits Example: Say you run a business and you want to raise profits. …You might be tempted to raise the price of your product in order to increase revenue from sales. BUT First you need to determine if your product is elastic or inelastic. *Medical devices and table salt=go for it! *Fruits and Veggies=No way. *You must investigate these prices and charts before setting a price. • That is why we need to know elasticity.
15 Insulin for a diabetic has inelastic demand. • True • False
III. Determinants of Demand Elasticity 3. What makes the demand for a specific good elastic or inelastic? We must ask 3 basic questions. • Can the purchase be delayed? • Are adequate substitutes available? • Does the purchase use a large portion of income?
A. Can the Purchase be delayed? • Example: A person with diabetes need insulin to control the disorder. An increase in its price is not likely to make insulin decrease. • Same goes for Tobacco. People are addicted. • These examples are inelastic. • Corn, tomatoes, or Gas then people might react different to price increase. • They can wait. Not much of an inconvenience. • These examples are elastic.
B. Are Adequate Substitutes Available? • Example: If beef or margarine prices raise than people can buy chicken or butter. • Another Example: The Post Office used to be able to raise its prices because not too many substitutes. Now with e-mail, fax, text messaging, etc, it is difficult for the Post Office to raise its prices and expect a profit. • The fewer substitutes available for a product, the more inelastic the demand.
C. Does the Purchase Use a Large Portion of Income? • The amount of income required to make the purchase. • If the answer is YES then the demand in elastic. • Check the Chart on p. 106. If there are more “YES” answers then the product is Elastic. • More “No” answers then the product is Inelastic.
4.3 EQ How do we measure total expenditures? P x Qd = TE Then what do we do with it? We use TE to determine if a product if elastic or inelastic
The End…. …of chapter 4