Demand
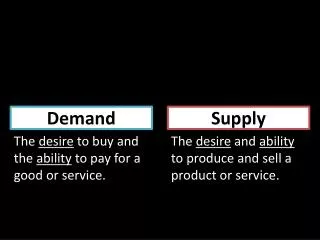
Demand. By. Janine Hepler. The desire to own something & the ability to pay for it Represents whole range of quantities. What is Demand?. Consumers will buy more of a good when its price is lower Consumers will buy less of a good when its price is higher


Demand
E N D
Presentation Transcript
Demand By. Janine Hepler
The desire to own something & the ability to pay for it • Represents whole range of quantities What is Demand?
Consumers will buy more of a good when its price is lower • Consumers will buy less of a good when its price is higher • Quantity demanded is higher at lower prices & vice versa • Inverse Relationship The Law of Demand
Demand Schedule Demand Curve • List/table showing how much of a product would be purchased at specific prices • Graphic illustration showing the relationship b/t price & quantity demanded at ALL prices • Shows every possible price/QD combination Representing Demand
*Demand schedules are used to create demand curves (more informative)
How much of an item a person demands at specific prices • Change in quantity demanded can only be caused by a change in a product’s price Quantity Demanded: Defined
When prices change (decrease/increase), consumers will change the mix of products that they buy • As the price of a product goes up… • Buy other goods to replace THAT product • As the price of a product goes down… • Buy THAT product to replace other goods The Substitution Effect
Substitute Complementary • Products that can replace each other • Butter & Margarine • Taxis & Buses • Beef & Chicken • Products that are used together • Peanut Butter & Jelly • Ketchup & Mustard • Cars & Car Washes • I-pods & I-Tunes Substitute & Complementary Goods
Name 3 goods that could be complements to hamburgers. • Name 3 goods that could be substitutes for movie tickets. Quick Review
Price of product • Buy MORE substitute goods • Buy LESS complementary goods • Price of product • Buy LESS substitute goods • Buy MORE complementary goods The Substitution Effect at Work
Normal Goods Inferior Goods • Things that you have always liked & bought regardless of income • Consumers will demand more normal goods as their income increases • Things that you buy only b/c you were unable to afford something else • Consumers will demand less inferior goods as their income increases Income Affects What You Buy
The change in consumption that results when a price increase causes real income to decline • Increasing/Decreasing prices changes the buying power of income • Income stays the same The Income Effect
The higher the price of pizza, the fewer slices people will buy Eating salad or tacos instead of pizza when the price of pizza increases Buying fewer slices of pizza when rising prices reduce real income Graphical representation of a demand schedule for the entire market Table that lists quantities of a good that a person will buy at each price Goods that you will always buy regardless of your income Demand Terms Review
Changes in Demand Shifting the Demand Curve
Latin phrase, “all other things held constant” • Demand schedules & curves are accurate taking into consideration price ONLY Ceteris Paribus
Sometimes increases/decreases in demand aren’t connected to price • When ceteris paribus is dropped, we allow other factors to change Changes in Demand
Income • Population • Demographics • Consumer Tastes & Advertising • Prices of Related Goods • Consumer Expectations Determinants of Demand
CHANGE IN QUANTITY DEMANDED CHANGE IN DEMAND • Change in the amount of a product at specific prices • Only brought on by a change in price • Movement along the demand curve • At every price, consumers demand a different quantity than before • Caused by ALL factors other than price • Shifts entire demand curve to the left or right
CHANGE IN QUANTITY DEMANDED CHANGE IN DEMAND Graphing the Changes ( )
Shift RIGHT—Rise (Increase in Demand) Shift LEFT—Loss (Decrease in Demand)
Factors That Influence Demand Determinants of Demand
As income increases… • Buy more normal goods • Buy less inferior goods (if any at all) As income decreases… • Buy less normal goods • Buy more inferior goods How do these changes affect the demand curve? Income
Current demand for a good is positively related to its expected future price If you expect prices to • Buy now If you expect prices to • Buy later Consumer Expectations
How would the demand curve for these items be affected in the event of a natural disaster warning?
Population changes have a strong effect on certain goods Example: U.S. Baby Boom • Baby clothes, food, books on baby care • Housing • Schools & Colleges • Retirement plans, medical care, RVs Population
Statistical characteristics of populations • Age, race, gender, occupation, income level, etc. As the purchasing power of groups grow… • Firms devote more resources to meeting their demands Demographics
Social trends, advertising, & the influence of the media affect demand • Companies spend $ on advertising in hopes of increasing demand • Conspicuous Consumption • “Keeping up with the Jones” Consumer Tastes & Advertising
The demand curve for one good can also shift in response to a change in demand for another good As product prices • Buy more substitute goods • Buy less complementary goods As product prices • Buy less substitute goods • Buy more complementary goods Prices of Related Goods
Why would McDonald’s or any other business offer free promotions to customers?
The Demand Curve is simply a reflection of what makes us happy • The happier something makes us, the more we would be willing to exchange for it • Higher demand The Demand Curve & Life
There is no obvious measure of happiness • Goosebumps, smiles, giggles, satisfaction points • Economists measure happiness in terms of utility • Measured in “utils” Utility
Utility is subjective & the result of personal tastes & preferences • Some people like sushi, some people like fish cooked • Some people like to shoot animals with cameras, others prefer rifles Subjectivity
Utility • Satisfaction from consuming a product Marginal Utility • the amount of satisfaction from 1 more unit of a product Diminishing Marginal Utility • Idea that as additional units of a product are consumed during a given period of time, the additional satisfaction decreases Consumer Satisfaction
A dollar will get you either 1 can of soup or a can of soda • The Average American purchases 19 cans of soda & only 1 can of soup per week • The marginal utility for a typical consumer for refrigerators starts high & plummets after a quantity of 1 • This is why there aren’t buy-one-get-one free sales—marginal utility doesn’t warrant the promotion Marginal Utility
Each additional unit of a good or service consumed provides less happiness (fewer utils) • Negative slope • The height of the curve indicates the most that consumers would be willing to pay for 1 more unit of a product Diminishing Marginal Utility
Consider This: • The average U.S. citizen consumes • 49.2 gallons of soft drinks • 67 lbs. of poultry • 12,406 kilowatt-hours of electricity • But have you ever heard of anyone with more than 1 subscription to the same newspaper? • Unless you love paper mâché or own a new puppy—the marginal utility of a 2nd newspaper is miniscule Diminishing Marginal Utility
Elasticity of Demand The Effect of Price Changes
Measures how much buyers will cut back/increase demand when prices change Are there products you would continue to buy, even if the price were to change drastically? Elasticity of Demand
ELASTIC INELASTIC • Demand sensitive (responsive) to price changes • Ex.) If you would buy less of a good after a small price increase • Demand that is NOT sensitive (responsive) to price changes • Ex.) If you would buy the same amount (or just a little less) after a large price increase Defining Elasticity
Elastic Demand • Demand is sensitive to price changes • Substitutes are available • Seen as a luxury • Substitutes can be found long term • Inelastic Demand • Demand is NOT sensitive to price changes • Substitutes are NOT readily available • Seen as a necessity • No time to react to price changes in the short term PROM
Calculating Elasticity Percentage Change in Quantity Demanded DIVIDED BY Percentage Change in Price
The Law of Demand implies that the result will always be negative • An increase in the price should decrease the quantity demanded & vice versa • Less than 1 = Inelastic • Keep buying regardless of price • More than 1= Elastic • Price affects buying Interpreting the Results
If elasticity is exactly equal to 1, then it is unitary elastic • Ex.) Suppose the elasticity for a magazine at $2 is unitary— • When the price rises by 50% to $3, exactly ½ as many copies will be sold as before Unitary Elastic