Understanding Demand and Its Influencing Factors
This comprehensive guide explores the concept of demand, highlighting how ticket availability, consumer desire, and price fluctuations play a critical role in determining demand levels. It discusses the Law of Demand—illustrating how price changes can inversely affect quantity demanded, accompanied by the substitution and income effects. Additionally, the guide explains demand schedules, demand curves, and factors leading to shifts in demand, such as consumer income, expectations, tastes, and related goods.


Understanding Demand and Its Influencing Factors
E N D
Presentation Transcript
Demand • Your favorite team is in the Super Bowl: • 1. How many tickets are available? • 2. How many people want tickets? • 3. What determines the price of a ticket?
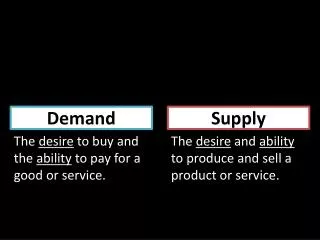
Demand • Demand: The desire to own something and the ability to pay for it. • Law of Demand: As the price of a good increases, quantity demanded decreases (and vice versa) • In other words: when price goes up, we buy less…when price goes down, we buy more
Why is the Law of Demand True? • 1. The Substitution Effect. occurs when consumers react to an increase in a good’s price by consuming less of that good… and more of other goods that satisfy the same basic need.OR
Why is the Law of Demand True? • 2. The Income Effect: The quantity of an item you consume changes if its price changes but your income does not.
Demand and Market Demand Schedule • Demand Schedule: a table that lists the quantity of a good that a person will purchase at each price in the market. • Market Demand Schedule: a table that lists the quantity of a good all consumers in a market will buy at each different price.
Question: • Assuming I get my candy for free, if the following market demand schedule is true, how much should I charge for M&M’s? Why?
From Demand Schedules to Demand Curves • Demand Schedule: a table that lists the quantity of a good that a person will purchase at each price in the market. • Market Demand Schedule: a table that lists the quantity of a good all consumers in a market will buy at each different price.
Demand Curves • So what is a demand curve? • Very Simple, a demand curve is just a graphical representation of a demand schedule.
A Few Terms You Need to Know 1. Complements: Products that you would purchase together. (Ex, Chips and Salsa). 2. Substitutes: Products that are similar. You would buy the other if the price of one got too high (Ex: Coke and Pepsi).
A Few Terms You Need to Know 3. Normal Good: A product that you buy more of as your income goes up. (EX: Cars, clothes, Xbox games, almost everything. 4. Inferior Good: A product you buy less of as income increases. (EX: Ramen Noodles, Mac & Cheese
Market Demand Curve 3.00 2.50 2.00 1.50 1.00 .50 0 Price per slice (in dollars) 200 250 350 300 0 50 100 150 Slices of pizza per day Remember the Demand Curve
Limits of a Demand Curve • Can only be used to predict how people’s buying habits might change when price and ONLY price changes • When price changes, it is called a movement along the demand curve or a change in quantity demanded (there’s no way to simply remember this…you must memorize! Sorry.)
Remembering this will save you time and frustration later… • Horizontal axis shows quantity • Vertical axis shows price • Let’s talk about horizontal, vertical, and quantity.
Changes in Demand • IMPORTANT: That demand schedule shows what happens to the quantity of pizza demanded when price, and ONLY price changes. • But there are other things that can cause the ENTIRE demand curve to shift.
Changes in Demand • Causes of a change in demand: • 1. Income (if we make more $, we will demand more of a good at any price. The opposite is also true!). • 2. Consumer expectations (If we expect prices to rise in the future, we’ll be more likely to spend more $ now. If we expect a sale, we will be less likely to spend more now).
Changes in Demand, cont. • 3. Consumer tastes and advertising (Think about it…why do companies use celebrities to promote their products?). • 4. Population (If population goes up…so does demand. Think baby boomer gen.). • 5. Prices of related goods (substitutes and compliments). (If the price of tortilla chips increases, what will happen to the demand for salsa?).
Market Demand Curve 3.00 2.50 2.00 1.50 1.00 .50 0 Price per slice (in dollars) 200 250 350 300 0 50 100 150 Slices of pizza per day This shows an increase in demand or rightward shift of the demand curve.
Let’s clarify the terms • What is the difference between a “change in quantity demanded” and a “change in demand” ? • Change in Quantity Demanded: a movement along the demand curve caused by a change in price
Let’s clarify the terms • Change in Demand: A shift in the demand curve due to factors other than price. Basically it shows that demand has changed at all different price levels. • Put a star next to this point in your notes.