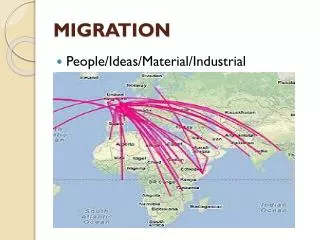
Migration
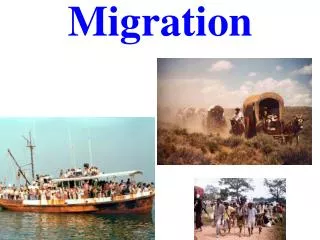
Migration. Salinas, CA. Haitian Refugees. Migration. Long term relocation to a new location outside the community of origin . Immigration. Migration inward to a location. Emigration. Migration outward of a location. American Migration Facts. 10,000,000 illegal immigrants in the U.S.

Migration
E N D
Presentation Transcript
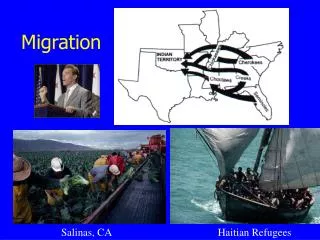
Migration Salinas, CA Haitian Refugees
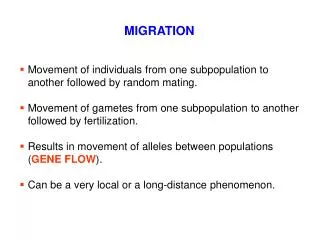
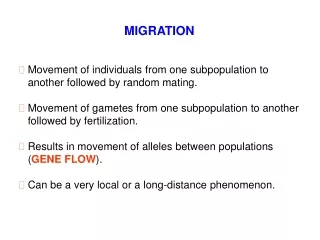
Migration • Long term relocation to a new location outside the community of origin Immigration • Migration inward to a location Emigration • Migration outward of a location
American Migration Facts • 10,000,000 illegal immigrants in the U.S. • Largest # of commuters in the world; Washington, DC 100 miles per day! • On average, American citizens move once every 6 years.
Top 10 Countries of Origin for US Legal Immigrants, 1998 Slide graphic courtesy of Dr. Jean-Paul Rodrigue, Hofstra University
Illegal Aliens in the United States by Country of Origin, 1996 (in 1,000s) Slide graphic courtesy of Dr. Jean-Paul Rodrigue, Hofstra University
Immigrants into the U.S. • Many immigrants provide remittance to home country. (Haiti GDP 15%) • Majority of legal migrants for Canada are recruited from Mexico • Immigration laws are funny and for certain groups. (Cubans: Wet-foot, Dry-foot)
Types of Migration • Internal Migration • Within one country. • Crossing domestic jurisdictional boundaries. • Movements between states or provinces. • Little government control. • Factors: • Employment-based. • Retirement-based. • Education-based. • Civil conflicts (internally displaced population). Ex: Peruvians moving from rural parts to Lima (city).
Types of Migration • International Migration • Between countries • Crossing country borders • More gov’t control. • Factors: • Economic • Family • Political conflicts
Spring Summer Fall / Winter Circular Migration • Takes us on a journey and brings us back-over short time span. • What you do within these distances is your activity space • Nomads are considered circular (action is repeated)
Periodic Movement • Involves returning home, HOWEVER, consider it to be where one spends the majority of their time. • Transhumance-Pastoral farming based upon seasonal availability of pastures • Also college or migrant work
Types of Migration • Voluntary migration • The migrant makes the decision to move. • Most migration is voluntary. • Military (10 Million Americans)
Forced Migration • -Involuntary migration in which the mover has no role in the decision-making process. • -Slavery. • -About 12-30 million African slaves were brought to the Americas between 1519 and 1867. • -In 1860, there were close to 4 million slaves in the United States. • -In early 20th century, African Americans moved North. • -Refugees • -Military conscription. • -Children of migrants. • -Situations of divorce or separation. • -Australian convicts • Irish potato famine is considered both voluntary and forced
Why do people migrate? • Push Factors-Reasons to leave • Pull Factors-Reasons attracting to a place instead of another place Major International Migration Patterns, Early 1990s
Push-Pull Trends • Men traditionally have more employment choices and income. • Males tend to migrate farther and are more mobile than women. • Push ex: 50,000 Asians left Uganda when dictator took power. • Push ex: Montserrat: volcanoes
Ravenstein Laws • Inverse relationship b/w migration and distance b/w the source & destination Says migrants who go longer distances tend to choose big-city destinations. Is…# of migrants decreases as the distance of travel increases. -Idea is called the Gravity Model.
Colonial Migration • Colonizers and exploration heavily influence migration patterns
Britain • Stimulated migration of S. Asians to Singapore, Fiji, and Trinidad (islands of development) • Also stimulated Chinese migration to SE Asia (are now minority) • Migration reached peak in 1835-1935.
Africa • Geographic realm most effected by the refugee problems. • Zanzibar (E. Africa) involved in slave trading to Islamic regions.
SW Asia • Afghanistan Civil war caused Soviet Union to get involved, caused many refugees. • After Gulf War, Kurds in the North were forced to leave Iraq (Saddam Hussain) • 2.5 million Afghanis counter migrated to Iran when Taliban took power in Afghanistan
Europe • Collapse of Yugoslavia in 1995 caused large refugee crisis.
World Migration Routes Since 1700 European African (slaves) Indian Chinese Japanese Majority of population descended from immigrants Slide graphic courtesy of Dr. Jean-Paul Rodrigue, Hofstra University
SE Asia • Largest # of migrants from Myanmar/Burma due to… S Asia • Sri Lanka refugees because of Tamil Tigers.
S. America • Columbia in 1997 • Fortified barriers. Examples?
Selective Migration • Excluding people with criminal records, health problems, or political beliefs not in line with the accepting country. • Many countries practice this • Is it discrimination?
U.S. Immigration Policies • 1882, Bars Asian immigration for ten years (extended) • 1921, Quota Act - country by country quotas (Europe) • 1924 National Origins Act - country by country quotas • 1965, Immigration Act - quotas for countries replaced, in 1968, with hemisphere quotas of 170, 000 for East and 120,000 for West • 1978, Immigration Act - global quota of 290, 000 • 1980, Refugee Act - quotas do not apply to those seeking political asylum • 1986, Immigration Reform and Control Act admitted large numbers of former illegal. • 1990, Immigration Act raised global quotas to roughly 675,000 • 1995, visas issued Preferentially: • 480,000 - to relatives of people here • 140,000 - to those with special skills and education • 55,000 - to diversity candidates (i.e., mostly not from Latin Amer. or Asia) Current Total: 675,000
Forced Migration The Trail of Tears, 1838
Slaves Reaching British North America, 1601-1867 (in 1,000s) Slide graphic courtesy of Dr. Jean-Paul Rodrigue, Hofstra University
U.S. Immigration Prior to 1840, 90% of U.S.immigration was from Britain Two Big Waves: 1840 - 1930: W. and N. European transitioning to Southern and Eastern European by 1910 • Irish (potato famine in 1840s) and Germans • During 1900s: Italians, Russians, Austria-Hungary (Czech, Poland, Romania, etc.) • 1950 - Today: Asians and Latin Americans; declining Europeans • Asians: China, India; 1980s -1990s: Phillipines, Vietnam, and South Korea • Latin America: Mexico, Dom. Rep., El Salvador, Cuba, Haiti • 1986 Immigration Reform and Control Actadmitted former illegals in 1990, 1991. Ellis Island National Monument
U.S. Migration Prior to 1840, 90% of U.S.immigration was from Britain Three trends: Destinations of U.S. Immigrants - ethnic neighborhoods often result of chain migration • Mexicans: California, Texas, Illinois, New York • Caribbean: Florida or New York • Chinese and Indians: New York & California • Other Asians: California • Armenians: ???? Ellis Island National Monument
US Population by Race and Ethnicity, 1990-2050 Slide graphic courtesy of Dr. Jean-Paul Rodrigue, Hofstra University
Population Pyramid of Native and Foreign Born Population, United States, 2000 (in %) Foreign Born Native Male Female Age Male Female Slide graphic courtesy of Dr. Jean-Paul Rodrigue, Hofstra University
Migration by Major Metropolitan Areas in the United States, 1990-98 (in 1,000s) Slide graphic courtesy of Dr. Jean-Paul Rodrigue, Hofstra University
The Ten Fastest-Growing Metropolitan Areas, 1990–2000Source: U.S. Census Bureau, Census 2000; 1990 Census. Web: www.census.gov
Interregional Migrations U.S. population has been moving Westward and Southward • Gold Rush (1849) and Donner Party just the most dramatic examples of hardship. • Wells, Pumps, Aqueducts, Mosquito Control and Air Conditioning have allowed this move which otherwise would be impossible. • Loss of Industrial Jobs in east compliments increase in Sunbelt service sector (biotech, communications).
Voluntary African-American Migrations Blacks moved to Industrial Belt (i.e., Chicago, New York, Detroit) and Los Angeles during World Wars (labor shortages).
Intraregional Migrations in U.S. • Developed Countries: suburbanization • automobiles and roads • ‘American Dream’ • better services • counterurbanization • idyllic settings • cost of land for retirement • slow pace, yet high tech connections to services and markets U.S. population has been moving out of the city centers to the suburbs: suburbanization and counterurbanization U.S. intraregional migration during 1990s.
Intraregional Migrations in LDCs • Urbanization • migration from rural areas • lack of jobs in countryside • lack of services in cities • Tokyo, Los Angeles, and New York only MDC cities on top 10 list Populations in the less developed world are rushing to cities in search of work and income. Lagos, Nigeria Mumbai, India Mexico City, Mexico