Global Migration and Water Resource Management Challenges
Explore the intricate patterns of international and internal migration, along with the impact on natural resources, especially water management challenges like those faced by the Colorado River and the Apalachicola-Chattahoochee-Flint water dispute. Discover the complexities of major global migration flows from the past to current challenges faced by regions like Southeastern US and China. Delve into the intricate negotiations, historical backgrounds, and ongoing issues related to water allocation and the distribution of resources in the face of population growth and climate change.


Global Migration and Water Resource Management Challenges
E N D
Presentation Transcript
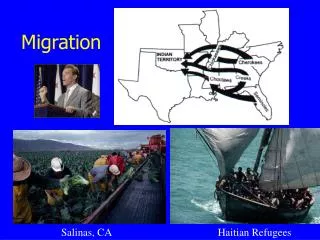
Migration: Where do people migrate?
Scales of Migration • International • Internal • Interregional • Intraregional
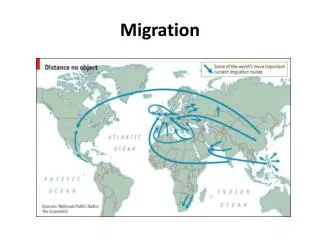
Major Global Migration Flows From 1500 to 1950
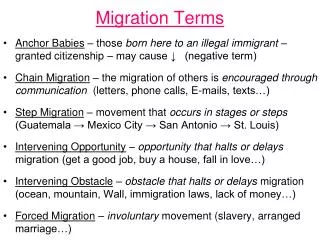
International Migration – Movement across country borders (implying a degree of permanence).
http://www.bbc.co.uk/scotland/education/geog/population/migration_map.shtmlhttp://www.bbc.co.uk/scotland/education/geog/population/migration_map.shtml
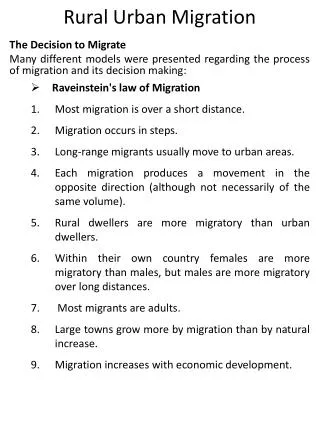
Internal Migration - Movement within a single country’s borders (implying a degree of permanence).
National Migration Flows • Also known as internal migration
Water, Water, Everywhere The Effect of Migration on Natural Resources
How compacts work – The Colorado River experience • Colorado River Compact (1922) Arizona, California, Colorado, Nevada, New Mexico, Utah, and Wyoming – and U.S. • Allocates waters based on future needs and water-use priorities. • After it was ratified, Congress agreed to build Hoover Dam (1928). • Arizona refused ratification until 1944, resented “inequitable division of its share of the lower Colorado.” • Major issues: • Mexico’s share of the river? • How determine how much water is available – science and policy?
Colorado River basin Compact Lake Mead (modified from Harding et. al 1995)
Ongoing challenges for the Colorado River compact • How much water is available? Compact assumes 7.5 million acre-feet in upper and lower basins , rest for Mexico (16.5 MAF total) – not true most years (closer to 11 million acre-feet). • Mexico’s share: (1944 treaty – 1.5 million acre ft./year). Desalination plant built in 1970s. Deliveries reliable, but problematic. • Arizona vs. California: (1963 Supreme Court decision) – “prior appropriation” doctrine does not apply to “lower basin” states); allowed U.S. government to build Central Arizona Project – to divert water to Phoenix, Tucson (1968) – forced CA to reduce water use to 4 million acre-feet, and decline over time. • 1 acre-foot = 386,000 gallons, or enough water for a family of four/one year
Southern California Distribution of Colorado River Compact water KEY: MWD – Metropolitan Water District (LA, Orange, San Diego, portions of Ventura, Riverside & San Bernardino Counties) CVWD – Coachella Valley Water District IID – Imperial Irrigation District PVID – Palo Verde Irrigation District CRA – Colorado River Aqueduct
Other compacts, other challenges Apalachicola-Chattahoochee-Flint water dispute: (began 1997). Centered on three rapidly growing states; one large metro area (Atlanta). Persistent drought – since 1980s worsens conflict, make negotiations to share water necessary. 1st major U.S. water dispute in a generation not in West. Led to first new river basin compact in over 30 years. Compact will NOT take effect until three states agree on an allocation formula – they’ve been unable to agree for 13 years!
Apalachicola-Chattahoochee-Flint River Basin • 2.6 million depend on basin for supply , 75% live in metro Atlanta. • Serves urban needs , agriculture, fisheries. • Severe impacts from runoff, impoundment, channelization. • Atlanta near source of Chattahoochee; a small volume river! • Inflow to Gulf important; major source of domestically harvested seafood – 15% of nation’s oyster harvest; 80% of Florida’s.
Drought in the South “Southeast drought hits crisis point” October 21, 2007 Lake Lanier, Chattahoochee River The Southeast's worst drought in more than a century is forcing parched states and communities (like Atlanta) into crisis measures to conserve water and fight for access to more . . . "This idea of wait-and-see, because some (rain) might be around the corner, can really suppress timely responses," says Mike Hayes, director of the National Drought Mitigation Center.
Population Growth & Water Use in ACF Basin Population growth – 1990-1999 (counties in grey have lost population) Total water use/consumptive & non-consumptive: 1995
What can we learn from Colorado and ACF compacts? Compacts need good scientific information– neither compact has fully embraced accurate information abut water availability. Both failed to adequately embrace the reality of drought and low-flow. There is a tendency for negotiators to focus on allocation FIRST, worry about availability 2nd. It’s easier to allocate when you think you have lots of water! Multi-purpose planning is needed – compacts succeed or fail depending on how they embrace regional needs (e.g., in-stream flow, urban supply, irrigation, pollution). CRC better at this than the ACF. Both compacts do a better job of listening to governments than to non-governmental groups (e.g., environmental activists).
http://www.nytimes.com/2013/06/16/world/asia/chinas-great-uprooting-moving-250-million-into-cities.html?pagewanted=all&_r=0http://www.nytimes.com/2013/06/16/world/asia/chinas-great-uprooting-moving-250-million-into-cities.html?pagewanted=all&_r=0
Waves of Immigration Changing immigration laws, and changing push and pull factors create waves of immigration.
1920s Quota Laws • Whose country is it? • Data Chart
1986 Immigration Reform & Control Act • Gives amnesty to approx. 3 mil undocumented residents • Punishes employers who hire persons who are here illegally • 1996 Illegal Immigration Reform & Immigrant Responsibility Act: toughening border enforcement, expands grounds to deport, strips immigrants of due process
1. The largest internal migration in history is A) the migration of Mexican workers to maquiladora factory towns from 1980 to present. B) the migration of Native Americans to reservations in the late 1800s. C) the migration of Muslims from India to Pakistan after World War II. D) the rural to urban migration in China from 1970 to present. E) the migration of Europeans to North America from 1600 to 1900.
2. Interregional migration was important in the Soviet Union because A) the government wanted to alleviate population pressures in existing cities. B) the government created industries in areas near raw materials instead of near markets. C) the government wanted to populate their country in a uniform manner. D) the government wanted to move different ethnicities around to mix them together. E) all of the above.
3. Which of the following represents the pattern of interregional African-American migration out of the Southern United States? A) Most African-Americans moved to Canada to escape slavery. B) Most African-Americans moved to the West Coast area of the United States. C) Most African-Americans moved to the rural areas of the Western United States. D) Most African-Americans moved to urban areas in the Northern United States. E) All of the above.
Economic Opportunities In late 1800s and early 1900s, Chinese migrated throughout Southeast Asia to work in trade, commerce, and finance.
Reconnecting Cultural Groups About 700,000 Jews migrated to then-Palestine between 1900 and 1948. After 1948, when the land was divided into two states (Israel and Palestine), 600,000 Palestinian Arabs fled or were pushed out of newly-designated Israeli territories.
Refugees • http://www.niceone.org/lab/refugees/
4. Which is a current intraregional migration trend in the United States? • metropolitan to non metropolitan b. net emigration from the northeast • urban to suburban d. rural to urban 5. In the United States, which is likely to cause virtually all population growth in the next couple of decades? • net in-migration b. crude birth rate c. natural increase rate d. declining death rate
6. Since 1790, the center of the United States population has moved • From southeast to northwest • From northeast to southeast • From southwest to northwest • From northeast to southwest
75% of immigrants to US are legal • 75% of immigrants are chain migration • 40% of illegal immigrants enter the country legally but overstay their visa