Propagation Delay Stability in Logic Devices
280 likes | 424 Vues
This paper presents data on propagation delays in logic devices, focusing on their distributions and changes over time. It includes life test data and examines the impact of factory qualification tests on propagation delays. Detailed analysis reveals characteristics of delay variations and provides insights into design rule efficacy. The study highlights significant findings regarding damage to programmed antifuses in logic devices, demonstrating the variability of delay changes and their implications for device reliability and performance over time.

Propagation Delay Stability in Logic Devices
E N D
Presentation Transcript
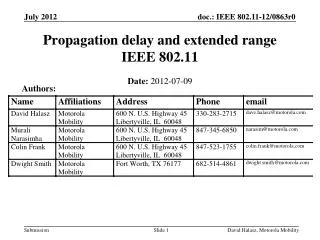
Propagation Delay Stability in Logic Devices Richard B. Katz NASA Office of Logic Design 2004 MAPLD International Conference September 8-10, 2004 Washington, D.C.
Abstract This paper will present data on propagation delays in logic devices, examining their distributions, the effects of life on propagation delay, and the characteristics of the changes in delays. Factory life test/qualification data will be presented along with recently taken in the evaluation of damage to programmed antifuses. Analysis of the data will be used to examine existing design rules, but for min/max analysis as well as those pertaining to the relative changes in delays.
CD4000B Propagation Delay Data tPD (ns)
RH1280 Life Test Delta Data Binning Delay Delta Data Summary (ns) Tested at VDD = 4.5V; T = 125 ºC
RT54SX72S: Propagation Delay vs. Life RTSX32S tPD sensitive to total ionizing dose in a Co-60 irradiation chamber. Design changes in the RTSX72S reduced the sensitivity to acceptable levels. These design changes were incorporated into the next revision of the RT54SX32S.
RT54SX72S: Propagation Delay vs. Life The following chart shows aggregate data from multiple lots of RT54SX72S FPGAs, totaling 1,040 individual devices. The speed data, with a mean delay of 73.8 ns, is measurements of the binning circuit, representative of logic paths, and is used to determine the device speed grade. Note that the delays over life do not necessarily "track," as there are both differences in the changes of delay as well as some differences in the sign of a delay change. • Construction of the RTSX-S Binning Circuits • 5 segmented vertical routing tracks are allocated to the binning column • Fixed length horizontal tracks • 3 Fuses per connection • Output • Cross connect • Input • Number of rows per device • RT54SX32S has 30 rows • RT54SX72S has 48 rows • Number of fuses = ((N-1) x 3) + 2 • RT54SX32S => ((30-1) x 3) + 2 = 89 • RT54SX72S => ((48-1) x 3) + 2 = 143
“fdelay” Measurements • 1144 logic modules configured in a ring oscillator configuration • Test Conditions: • Temp = +25 °C • VCCA = 2.5 VDC • VCCI = 3.3 VDC • Test = 7 (I/Os static) • This is not a typical accelerated test; it is “de-accelerated” • RTSX32S and RTSX32SU Devices • Ring oscillator and nominal conditions - YUCHH!!
“fdelay” Circuit I hate ring oscillators; use a clock..
RTSX32S Distribution @ 24 Hours Intrinsic distribution is tightly grouped. Outliers are devices with damaged programmed antifuses.
RTSX32S Distribution StatisticsPerformance Over 600 Hour Test, Nominal Conditions All delays are in ns.
RTSX32S 24 Hour Outlier Performance Damaged programmed antifuses show signs of instability over the course of the test. Note S/N 34319 first decreases in speed and then returns close to its initial value.
RTSX32S tPD Delta Analysis24 to 168 Hours Intrinsic population is stable over the course of the test. Outliers are devices with damaged programmed antifuses with delta delays ranging from 10’s of ns to hundreds of ns. Other data shows delays from damaged devices may exceed 1 µs. Mean delay is ~ 930 µs.
RTSX32S tPD AnalysisStartup Transient Frequency measurement at startup. Ring oscillator period increases for a considerable period of time before stabilizing, likely a result of self-heating, as digital CMOS slows with increased temperature. One of the two “practice parts” shows a discontinuity.
RTSX32S tPD AnalysisStartup Transient Frequency measurement of three devices with damaged programmed antifuses. Note the discontinuity, showing instability of the damaged element. Additional test data confirmed the instability of damaged programmed antifuses in a different S/N device.
RTSX32SU Distribution @ 168 Hours Intrinsic distribution is tightly grouped. 100 devices, ~20 the number used in the SX32S test.
RTSX32SU Distribution StatisticsPerformance Over 504 Hour Test All delays are in ns.
RTSX32SU tPD Delta Analysis0 to 504 Hours Intrinsic population is stable over the course of the test. Mean delay is ~ 1,125 ns; deltas, even with measurement errors, are less then 1%.
Analysis of fdelay @ 0 Hours: Composite UNCHECKED
Conclusions • Distributions of tPD is fairly tight for modern devices. • Changes of tPDover life tests is fairly tight for modern devices. Using ± 10% for delta tPD is appropriate. • Changes of tPDover life tests is not a constant and may be bipolar. Qualifying asynchronous races by test can not be supported. • Analysis of changes of tPD over time provides a strong indicator of element failure. Absolute values of delay is insufficient as a screen or test. • Data is now available to show that damaged programmed antifuses are not stable over time. Thus, functional testing is insufficient as a screen for damaged programmed antifuses.
Appendix:Test Vehicle and Protocol for NASA Independent Testing of SX-A, SX-S, and SX-SU Programmed Antifuses
NASA Device Testing Strategy The testing will consist of exposing devices to a dynamic operating environment with multiple stressors: • Temperature (-55 °C and +125 °C) • Increasing VCCA core voltages, starting at VCCA = 2.75V. • Increasing the number of simultaneous switching outputs (SSOs) • Increasing the amount of simultaneous switching undershoot (SSU) • Loading of internal nets 20% greater than the maximum that the design rule check (DRC) will permit for user designs. • The use of all architectural features in the device Testing will proceed in a series of stress steps, the duration of each step will be 480 hours, with 240 hours at +125 °C and 240 hours at -55 °C.
Differences from “Tiger Team” Design • Temperature: For NASA flight projects, testing should envelope operating conditions with considerable margin. -55 °C to +125 °C achieves that goal while being a practical test temperatures; Tiger team testing is performed at "room temperature.“ • VCCA core voltages will also envelope the flight operating regime. The initial Tiger Team testing was performed at VCCA=2.5V, in the middle of the operating range, with later testing to be done at VCCA=2.75, the maximum of the operating range. The NASA testing will start at VCCA=2.75 and then increase the voltage with each step, for margin testing and acceleration. • Internal Net Loading: The maximum number of logical loads for operating systems is 24. The NASA design will have a number of critical nets running with a load of 29, which is slightly greater than a 20% margin. The Tiger Team design has a maximum load of 16, below the limit of both the DRC and many flight designs. • Clocking: The device under test (DUT) to be stimulated by a crystal clock oscillator through both the HCLK and one of the two routed array clocks, with functional circuits on each clock network. This is a superset of the Tiger Team design, where neither of the clock inputs are utilized (internal ring oscillators are used to manufacture clock signals) and the HCLK network is static. Reviews of many NASA designs shows that most designs utilize the HCLK and thus must be tested. • Propagation delay is measures through a linear arrangement of gates, not with a ring oscillator. • Hand placement and analysis was performed to ensure usage of elements such as long horizontal tracks (LHT) and long vertical tracks (LVT) for loading.
Key Characteristics of NASA DUT Design • HCLK is used for the I/O shift register and CLKA is used for the array shift register (no ring oscillators are present in this pattern). The I/O shift register has logic modules between sequentially adjacent flip-flops; the array register does not, thus maintaining the design’s sensitivity to small changes in clock skew. • Array shift register chains are segmented in such a manner to enable precise fanout control. There are 23 signals with a fanout of 29. The limit for user hardware is is 24. • An array shift reg segment is manually placed to ensure utilization of the long horizontal and vertical tracks (LHTs and LVTs). • All I/O registers are manually placed at the sequential tile nearest to the I/O buffer that it is driving. The implications of this, combined with the use of the HCLK, are both more realistic testing since HCLK usage in flight designs is high and making the SSO "more simultaneous" since the HCLK inherently has lower skew than the routed array clock, as has been used in the Tiger Team pattern for similar purposes.
Resource Utilization of NASA DUT Design • SEQUENTIAL Used: 1080 Total: 1080 100% • COMB Used: 1800 Total: 1800 100% • LOGIC Used: 2880 Total: 2880 100% (seq+comb) • IO w/ Clocks Used: 168 Total: 170 99% • CLOCK Used: 2 Total: 2 100% • HCLOCK Used: 1 Total: 1 100%
Antifuse Distribution of NASA DUT DesignPreliminary - Not Finalized Fill in final values