Download
1 / 12
120 likes | 233 Vues
Gulf of Mexico Oil Leak. Current Status, Impacts, and Everglades Foundation Involvement. Photo sequence of Deepwater Horizon from April 20-22, 2010 (images taken from Hall/Penniman report). Deepwater Horizon Leak Information. Initial estimate of 1,000 barrels (42,000 gallons) per day

E N D
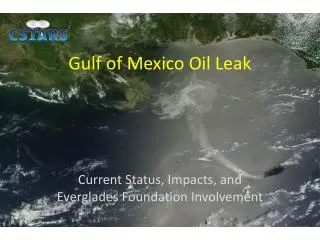
Gulf of Mexico Oil Leak Current Status, Impacts, and Everglades Foundation Involvement
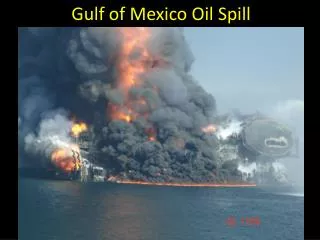
Photo sequence of Deepwater Horizon from April 20-22, 2010(images taken from Hall/Penniman report)
Deepwater Horizon Leak Information • Initial estimate of 1,000 barrels (42,000 gallons) per day • Currently estimated at 5,000 barrels (210,000 gallons) per day • Some estimate much higher (25,000 – 80,000 bbl/day) • Surface strategies for mitigation/clean-up • Heavy use of dispersants • Skimmers, booms and fire • Subsurface control measures • Subsea Oil Recovery System (clogged with gas hydrate crystals) • Riser insertion siphon (estimated 1,000 barrels per day) • “Top kill” or “junk shot” (next) • Relief well (underway) • Could take months to completely stop
2-Week Simulation of Buoyant Particle Transport Via Loop Current (source: Dr. Robert Weisberg, Univ. South Florida)
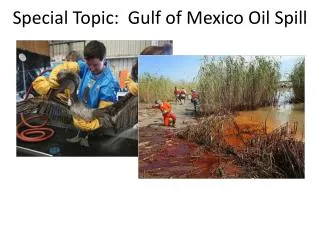
Biological Impacts • Still to be determined • may take years to begin full assessment • may never fully comprehend • Direct exposure and “Bottom-up” (food web) • Dissolved oxygen: has already dropped 30% in affected areas • Fisheries • commercial finfish and shellfish (1.3 million lbs landed in 2008) • nursery (all fishery species and many endangered or threatened) • sport fishing (> 3.2 million fishermen in 2008) • Marine Mammals (21 species) • Sea turtles (5 species) • Birds (numerous seabirds, shore birds, wading birds, etc.) • Critical coastal everglades ecosystems (mangrove, seagrass, and coral reef).
Billfish larvae in upper Gulf of Mexico (2005-2009) (source: Dr. Jay Rooker, Texas A&M-Galveston) Sailfish White marlin Blue marlin Mean Density (No. per 1000m2)
Satellite-derived Presence of Oil (May 13) (source: Dr. Chuanmin Hu, Univ. South Florida)
Satellite-derived Presence of Oil (Terra, 2010-05-17 16:36 UTC, MODIS )
May 15-20 Simulation of Particle Transport Via Loop Current (RTOFS) (source: Dr. Robert Weisberg, Univ. South Florida)
May 15-20 Simulation of Particle Transport Via Loop Current (HYCOM) (source: Dr. Robert Weisberg, Univ. South Florida)
Hydrocarbons below the surface? • Evidence indicates oil plumes at depths of 4,000 ft. and 2,000 ft. below surface. • Greatly complicates our predictive capacity (i.e., going from 2-D to 3-D). • Might explain why surface plume has not grown dramatically over the past few weeks. • May be a result of massive pumping of dispersants into leak area.
What are we doing? • Will continue to follow story as it unfolds • Will continue to engage scientists that are: • actively tracking and modeling oil • studying impacts on • Water quality • Reef, seagrass, and mangrove ecosystems • Fish, marine mammals, wading birds, etc. • Engaging the media, resource managers, and politicians regarding spill and potential impacts • Working with National Park Service to develop a water quality program capable of detecting low-level contamination.