Download
1 / 21
210 likes | 324 Vues
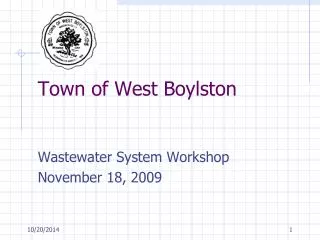
Town of West Boylston. Wastewater System Workshop November 18, 2009. Tonight’s Program. Customer Types Commercial (4) Residential (3) Usage and Billing History FY 2008 FY 2009 FY 2010 Y-T-D. Tonight’s Program. Average Bills Commercial (4) Residential (3) Trend Analysis Next Steps.

E N D
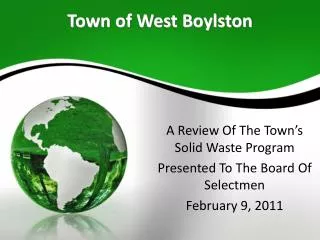
Town of West Boylston Wastewater System Workshop November 18, 2009
Tonight’s Program • Customer Types • Commercial (4) • Residential (3) • Usage and Billing History • FY 2008 • FY 2009 • FY 2010 Y-T-D
Tonight’s Program • Average Bills • Commercial (4) • Residential (3) • Trend Analysis • Next Steps
Customer Types • Four Commercial Users • Minimum User – SC1 • Small User – SC1-T1 • Under 20,196 Gallons • Large User – SC1-T2 • Under 20,196 Gallons • Over 20,196 Gallons • No Meter User - SCF
Customer Types • Three Residential Users • Minimum User – SR1 • Meter User – SR1 • Billed for 80% of Use • 2nd Meter User – SR3 • Billed for Gross Water Used Net Of Outside Meter Use
Total Wastewater Use History • FY 2008 • Ave Users = 1,756 • Total Use = 113,438,914 Gal • Total Billed = 96,410,510 Gal • Ave Use = 64,592 Gal • FY 2009 • Ave Users = 1,902 • Total Use = 110,581,136 Gal • Total Billed = 93,197,564 Gal • Ave Use = 58,155 Gal
Commercial Usage History • FY 2008 • Ave Users = 138 (8%) • Total Use = 25,317,135 Gal (22%) • Ave Use = 183,126 Gal • Min User = 38 @ 4,493 Gal • Small User = 36 @ 38,540 Gal • Large User = 62 @ 380,260 Gal • No Meter User = 2 @ 68,460 Gal
Commercial Usage History • FY 2009 • Ave Users = 156 (8%) • Total Use = 20,772,868 Gal (19%) • Ave Use = 133,588 Gal • Min User = 48 @ 4,483 Gal • Small User = 44 @ 39,262 Gal • Large User = 62 @ 301,492 Gal • No Meter User = 2 @ 41,519 Gal
Residential Usage History • FY 2008 • Ave Users = 1,618 (92%) • Total Use = 88,121,779 Gal (78%) • Total Billed = 71,093,375 Gal • Ave Use = 54,463 Gal • Min User = 192 @ 9,265 Gal • Meter User = 1,408 @ 60,481 Gal • 2 Meter User = 19 @ 64,297 Gal
Residential Usage History • FY 2009 • Ave Users = 1,746 (92%) • Total Use = 89,808,268 Gal (81%) • Total Billed = 72,424,696 Gal • Ave Use = 51,437 Gal • Min User = 221 @ 9,109 Gal • Meter User = 1,507 @ 57,686 Gal • 2 Meter User = 18 @ 48,619 Gal
Commercial User Billing • FY 2008 Billings • All = 183,126 Gal @ $ .01145 = $ 2,098 • Min = 4,493 Gal @ $ .02670 = $ 120 • Small = 39,540 Gal @ $ .00916 = $ 362 • Large = 380,260 Gal @ $ .01148 = $ 4,367
Commercial User Billing • FY 2009 Billings • All = 133,588 Gal @ $ .01126 = $ 1,505 • Min = 4,483 Gal @ $ .02676 = $ 120 • Small = 39,262 Gal @ $ .00899 = $ 353 • Large = 301,492 Gal @ $ .01129 = $ 3,404
Residential User Billing • FY 2008 Billings • All = 54,463 Gal @ $ .00906 = $ 398 • Min = 9,265 Gal @ $ .01295 = $ 120 • Meter = 60,481 Gal Less 20% = 48,385 Gal @ $ .00895 = $ 433 • 2 Meter = 64,297 Gal @ $ .00912 = $ 586
Residential User Billing • FY 2009 Billings • All = 51,437 Gal @ $ .00907 = $ 376 • Min = 9,109 Gal @ $ .01317 = $ 120 • Meter = 57,686 Gal Less 20% = 46,149 Gal @ $ .00896 = $ 413 • 2 Meter = 48,619 Gal @ $ .00903 = $ 439
Trend Analysis • Use Trend Is Down • Costs Trend Is Up • O&M Up 27% in FY ’09 • FY ’10 O&M Budget Increased 4.5% • Revenue Trend Is Down • FY ’09 Income Down 9.5% From FY ’08 • Non-Recurring Revenue Use Trend Is Up • $219,000 RE Use In FY ’10 • $148,244 RE Use In FY ’09 • A/R Growth Trend Is Up • FY ’10 Should See Turn
Next Steps • Staff • Monitor FY 2010 • Prepare Budget • FY ‘10 Done • FY ‘11 Pending • Forecast FY’s ’12 & ’13 • Develop Revenue Requirements • Plan Second Workshop
Next Steps • Commissioners • Review Tonight’s Material • Consider New Rate Design • Minimum Bills • Usage Discounts • Block Rates • Usage Premiums • Hold Second Workshop • Set New Rates