Interactive Data Visualization Techniques in Baseball Analysis
Explore dynamic queries, brushing, linking for interactive data visualization of baseball data. Focus on player statistics such as salary, batting ability, fielding ability, and player positions played. 8 Relevant

Interactive Data Visualization Techniques in Baseball Analysis
E N D
Presentation Transcript
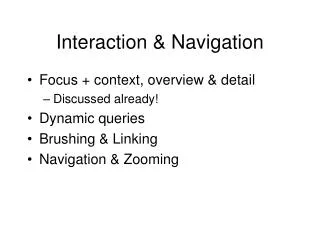
Interaction & Navigation • Focus + context, overview & detail • Discussed already! • Dynamic queries • Brushing & Linking • Navigation & Zooming
Highlighting (Focusing) Focus attention on a subset of the data (from Wills 95, Visual Exploration of Large Structured Datasets) [www.sims.berkeley.edu/courses/is247/s02/lectures/Lecture3.ppt]
Baseball data (from Wills 95) how long in majors select high salaries avg career HRs vs avg career hits (batting ability) avg assists vs avg putouts (fielding ability) distribution of positions played [www.sims.berkeley.edu/courses/is247/s02/lectures/Lecture3.ppt]
Linking types of assist behavior to position played (from Wills 95) [www.sims.berkeley.edu/courses/is247/s02/lectures/Lecture3.ppt]