ShakeMap Now
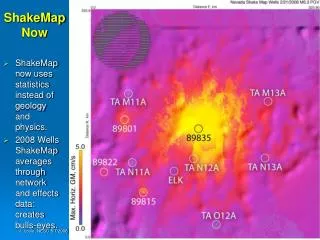
ShakeMap Now. ShakeMap now uses statistics instead of geology and physics. 2008 Wells ShakeMap averages through network and effects data: creates bulls-eyes. Put in Geology and Physics. Wells, NV M6.0 2/21/2008 Requires extensive geological data sets

ShakeMap Now
E N D
Presentation Transcript
ShakeMapNow • ShakeMap now uses statistics instead of geology and physics. • 2008 Wells ShakeMap averages through network and effects data: creates bulls-eyes.
Put in Geology and Physics • Wells, NV M6.0 2/21/2008 • Requires extensive geological data sets • Plus intensive computation of PDE solutions
Wells,Computed Shaking Map • Geologic basins channel quake waves
Wells, Computed Shaking Match to Data • With correct fault scenario (orange), physics and geology match data (red).
4/25/08 M5.0 Mogul MainshockShakeMap Anomalously high shaking in hills north of Reno In Reno-Carson we lack critical geological constraints: parcel mapping; and the fault network.
Reno-Area Basin Geological Data UNR researchdevelopeda transect and map of <100 shallow measurements- far short of parcel mapping. UNR and Washoe County have been investigating the basin geology.
Mogul, Computed Shaking Map • The physics is OK, the faulting is simple, and the geology is the best we know, but…
Mogul, Computed Shaking Matches to Data • Our geological knowledge can’t yet explain the highest shaking!
Las Vegas Computed Shaking Maps Two Death Valley event scenarios and 2006 geological data
2006 Geological Data Doesn’t Explain High Shaking Uncertainty in PGV
Initial 6 Months of Clark Co. Parcel Mapping 1265 sites by March 2008 ~9000 sites by July 2010 completion NEHRP B-C boundary is clearly defined; C-D is hard to predict.
Detailed Surface Geology Makes a Difference • ShakeMap-type statistical prediction (left) for Las Vegas. • Physics-based prediction (right) has spotty, large ground motions. 73% predicted for 2-4 Hz Up to 213% computed for 0.5 Hz
Nevada Can Lead the US to theNext Level of ShakeMap: for Reno/Carson • $1.0M to define the fault network • Seismic surveys and fault trenching in the basins • $0.5M for shallow measurements • Earthquake-hazard mapping by measurement, not extrapolation • $1.0M to develop a ShakeMap based on physics and geology • Computed 5 min. after the earthquake, guiding emergency response • Validated with new monitoring instrumentation