Kinetic
Spin, T S. CMB. Kinetic. Ionized fraction x i = 1 - x HI. Mean brightness temperature. Pritchard & Loeb 2008. 3 observational techniques: 21 cm forest Power spectrum/tomography Global spectrum. 1. 21 cm forest. But not until 2020+. Carilli et al. (2004). 2. Power spectrum. (3D)

Kinetic
E N D
Presentation Transcript
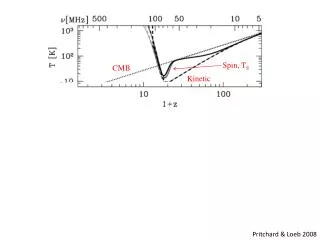
Spin, TS CMB Kinetic Ionized fraction xi = 1 - xHI Mean brightness temperature Pritchard & Loeb 2008
3 observational techniques: • 21 cm forest • Power spectrum/tomography • Global spectrum
1. 21 cm forest But not until 2020+ Carilli et al. (2004)
2. Power spectrum (3D) z~100 (2D) 21 cm CMB Kleban et al. 2007 Loeb & Zaldarriaga 2004
2. Power spectrum “Science with the MWA” Greenhill, Bowman, et al. (2010, in prep) Figure by Matt McQuinn
2. Power spectrum [21cmFast simulation]
3. Global spectrum J. Pritchard
3. Global spectrum N_ion f_esc f_star f_lya f_xray - Number of ionizing photons per baryon in star formation - Escape fraction of ionizing photons from galaxies (probably between 0.02 and 0.2) - Star forming efficiency by mass (uncertain to order of magnitude) - Number of Ly- photons per baryon in stars (popII) (uncertain to a factor of few) - X-ray luminosity relative to value extrapolated from Glover and Brand (uncertain to more than order of magnitude) Code from J. Pritchard
3. Global spectrum Primordial BH evaporation Mack & Wesley (2008)
Murchison Widefield Array (MWA) Science: 21 cm cosmology, heliosphere, transients, and Galactic physics
MWA: Antenna Tile 1 2 3
MWA 32 tiles 150 m
MWA first image with correlator Parkes reference image 32 MHz multi-frequency synthesis with 32 tiles [13 Jan 2010] – 5 minute snapshot C. Williams (MIT)
MWA full array rendering 1.5 km
MWA 1-year power spectrum sensitivity 4 redshift bands, 300 hours each 21 cm from Lidz et al. 2009 MWA uncertainty from Bowman et al. 2006
Experiment to Detect the Global Epoch of Reionization Signature (EDGES)
EDGES Bowman & Rogers 2010
EDGES block diagram ou t of band noise injection AEER
Internally-switched calibration • 3-position switch to measure (cycle every 10s): • Solve for antenna temperature: (Tcal > TL 300 K, TA 250 K, TR 20 K) • Results: >105 dynamic range achieved with EDGES • Limitations: • Total power differences between TL and TA can leave systematic errors • Temporal variations: comparing measurements at different times
Internally-switched calibration Noise source (p1) Internal load (p0) Antenna (p2) p1– p0 “Calibrated” sky spectrum w/ RFI filtering and integration “Calibrated” sky spectrum T_A ~ (p2 – p0) / (p1 – p0) p2 – p0
Measured spectrum Murchison Radio-astronomy Observatory (MRO) Aug 20 – Oct 20, 2009 1440 wall-clock hours on sky 500 hours after RFI cuts 50 hours eff. integration +15 dB
Parameter estimation #1: 21 cm reionization model #2: Foreground model 2 science parameters: z and zr 4-19 nuisance parameters: an Pritchard & Loeb (2010, submitted)
Lower limit on duration zr > 0.06 for 6 < zr < 13 (95% confidence) Bowman & Rogers, Nature, 468, 7325, pp. 796-798 (2010)
EDGES reionization forecast Pritchard & Loeb (2010)
21 cm array site selection Sydney Narrabri MRO 100 MHz 1 GHz Annotated by F. Briggs
US TV and FM radio “pollution” West Forks, Maine D1 Array – Haystack Obs.
Catlow Valley, Oregon, US EDGES Memo#052, AEER, JDB, 2009 60 dB 80 MHz 200 10 dB