Download
1 / 123
1.23k likes | 1.25k Vues
This analysis provides an informed and objective conversation on the housing needs of the Wasatch Front until 2065, aiming to assist public officials, planners, developers, and citizens in meeting these needs fairly and equitably.

E N D
Arthur C. Nelson, Ph.D., FAcSS, FAICPEmeritus ProfessorCity & Metropolitan PlanningUniversity of UtahProfessor of Planning & Real Estate DevelopmentUniversity of Arizona
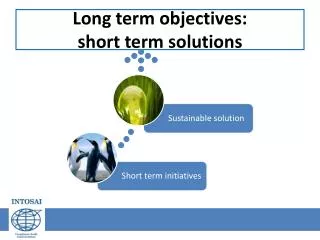
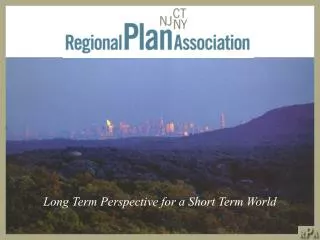
Not a Short Term Housing ForecastBut a Long Term ViewWith Challenges that Must be Met Soon
120 miles long25 miles wide1,400 square miles http://hanatemplate.com/images600_/long-island-clip-art-4.png
120 miles long25 miles wide1,400 square miles https://www.researchgate.net/profile/Paul_Waddell/publication/235359996/figure/fig2/AS:667806513262594@1536228888098/Wasatch-Front-Study-Area-and-Sample-Locations-for-Sensitivity-Analysis.png
Purpose To inform public officials, planners, developers and citizens of the broad housing needs facing the Wasatch Front to 2065.
Purpose To start an informed and objective conversation on how local governments can help the state meet housing needs to 2065 fairly and equitably.
Analysis Geography • Utah as a whole • Wasatch Front Counties (but not Wasatch back) • Weber County • Davis County • Salt Lake County • Utah County
Analysis Geography • Utah as a whole • Wasatch Front Counties (but not Wasatch back) • Weber County • Davis County • Salt Lake County • Utah County
Analysis Geography • Utah as a whole • Wasatch Front Counties (but not Wasatch back) • Weber County • Davis County • Salt Lake County • Utah County
Analysis Geography • Utah as a whole • Wasatch Front Counties (but not Wasatch back) • Weber County • Davis County • Salt Lake County • Utah County
Analysis Geography • Utah as a whole • Wasatch Front Counties (but not Wasatch back) • Weber County • Davis County • Salt Lake County • Utah County
Analysis Geography • Utah as a whole • Wasatch Front Counties (but not Wasatch back) • Weber County • Davis County • Salt Lake County • Utah County
Outline • The Big Population Picture 2015-2065 • The Big Household Picture 2015-2065 • Demand by Race/Ethnicity • Demand by Householder Age • Housing Demand by Tenure • Counties • Major Cities • Downtowns Anyone? • Tear up a Parking Lot, Rebuild Paradise • Put Everything on the Table • Framework for Discussion
Outline • The Big Population Picture 2015-2065 • The Big Household Picture 2015-2065 • Demand by Race/Ethnicity • Demand by Householder Age • Housing Demand by Tenure • Counties • Major Cities • Downtowns Anyone? • Tear up a Parking Lot, Rebuild Paradise • Put Everything on the Table • Framework for Discussion
Outline • The Big Population Picture 2015-2065 • The Big Household Picture 2015-2065 • Demand by Race/Ethnicity • Demand by Householder Age • Housing Demand by Tenure • Counties • Major Cities • Downtowns Anyone? • Tear up a Parking Lot, Rebuild Paradise • Put Everything on the Table • Framework for Discussion
Outline • The Big Population Picture 2015-2065 • The Big Household Picture 2015-2065 • Demand by Race/Ethnicity • Demand by Householder Age • Housing Demand by Tenure • Counties • Major Cities • Downtowns Anyone? • Tear up a Parking Lot, Rebuild Paradise • Put Everything on the Table • Framework for Discussion
Outline • The Big Population Picture 2015-2065 • The Big Household Picture 2015-2065 • Demand by Race/Ethnicity • Demand by Householder Age • Housing Demand by Tenure • Counties • Major Cities • Downtowns Anyone? • Tear up a Parking Lot, Rebuild Paradise • Put Everything on the Table • Framework for Discussion
Outline • The Big Population Picture 2015-2065 • The Big Household Picture 2015-2065 • Demand by Race/Ethnicity • Demand by Householder Age • Housing Demand by Tenure • Counties • Major Cities • Downtowns Anyone? • Tear up a Parking Lot, Rebuild Paradise • Put Everything on the Table • Framework for Discussion
Outline • The Big Population Picture 2015-2065 • The Big Household Picture 2015-2065 • Demand by Race/Ethnicity • Demand by Householder Age • Housing Demand by Tenure • Counties • Major Cities • Downtowns Anyone? • Tear up a Parking Lot, Rebuild Paradise • Put Everything on the Table • Framework for Discussion
Disclosures • All projections are precisely wrong … • Extensive reliance on Gardner Institute projections which are subject to extensive qualifications. • Preliminary Woods & Poole demographic data are applied to Gardner Institute and Wasatch Front Regional Council projections. • WFRC and Woods & Poole projections go to 2050 so extrapolations are made to 2065. • Investors use these projections as one data point. • Projections are crucial for informed public policy and infrastructure investment.
Disclosures … but approximately right. • Extensive reliance on Gardner Institute projections which are subject to extensive qualifications. • Preliminary Woods & Poole demographic data are applied to Gardner Institute and Wasatch Front Regional Council projections. • WFRC and Woods & Poole projections go to 2050 so extrapolations are made to 2065. • Investors use these projections as one data point. • Projections are crucial for informed public policy and infrastructure investment.
Disclosures • All projections are precisely wrong … … but approximately right. • Extensive reliance on Gardner Institute projections which are subject to extensive qualifications. • Preliminary Woods & Poole demographic data are applied to Gardner Institute and Wasatch Front Regional Council projections. • WFRC and Woods & Poole projections go to 2050 so extrapolations are made to 2065. • Investors use these projections as one data point. • Projections are crucial for informed public policy and infrastructure investment.
Disclosures • All projections are precisely wrong … … but approximately right. • Extensive reliance on Gardner Institute projections which are subject to extensive qualifications. • Preliminary Woods & Poole demographic data are applied to Gardner Institute and Wasatch Front Regional Council projections. • WFRC and Woods & Poole projections go to 2050 so extrapolations are made to 2065. • Investors use these projections as one data point. • Projections are crucial for informed public policy and infrastructure investment.
Disclosures • All projections are precisely wrong … … but approximately right. • Extensive reliance on Gardner Institute projections which are subject to extensive qualifications. • Apply preliminary Woods & Poole demographic data to Gardner Institute and Wasatch Front Regional Council projections. • WFRC and Woods & Poole projections go to 2050 so extrapolations are made to 2065. • Investors use these projections as one data point. • Projections are crucial for informed public policy and infrastructure investment.
Disclosures • All projections are precisely wrong … … but approximately right. • Extensive reliance on Gardner Institute projections which are subject to extensive qualifications. • Apply preliminary Woods & Poole demographic data to Gardner Institute and Wasatch Front Regional Council projections. • WFRC and Woods & Poole projections go to 2050 so extrapolations are made to 2065. • Investors use these projections as one data point. • Projections are crucial for informed public policy and infrastructure investment.
Disclosures • All projections are precisely wrong … … but approximately right. • Extensive reliance on Gardner Institute projections which are subject to extensive qualifications. • Apply preliminary Woods & Poole demographic data to Gardner Institute and Wasatch Front Regional Council projections. • WFRC and Woods & Poole projections go to 2050 so extrapolations are made to 2065. • Investors use these projections as one data point. • Projections are crucial for informed public policy and infrastructure investment.
Demographics is a Better Predictor than Economics • What will the economy will be like in 10 years? • How old will you be in 10 years?
Demographics is a Better Predictor than Economics • What will the economy will be like in 10 years? • How old will you be in 10 years?
The Big Population Picture 2015-2065 Source: Kem C. Gardner Policy Institute. Figures in thousands.
The Big Household Picture 2015-2065 Source: Kem C. Gardner Policy Institute. Figures in thousands.
Declining Household Size Source: Kem C. Gardner Policy Institute. Figures in thousands.
More Housing Needed Because of Declining Household Size Source: Arthur C. Nelson. Figures in thousands.
Most New Households in Wasatch Front Will be Minority Source: Arthur C. Nelson adapting KemC. Gardner Policy Institute and Woods & Poole Economics data. Figures in thousands.
Large Homes & Large Lots Will Not Dominate the Future Source: Arthur C. Nelson adapting KemC. Gardner Policy Institute and Woods & Poole Economics data. Figures in thousands.
Large Homes & Large Lots Will Not Dominate the Future 75% 62% 63% 51% 61%
Has a Tenure Shift Begun?2009-2017 Source: Census 1-year for 2009 and 2017. Figures in thousands.
Tenure Allocations to Cities • Preliminary WFRC data on households by income categories, 2015—2050. • Extrapolation to 2065 applied to Gardner Institute projections.
Allocations to Cities • Preliminary WFRC data on households by income categories, 2015—2050. • Extrapolation to 2065 applied to Gardner Institute projections.
Housing Demand by Household Income • HH Income Under $35,000 • Nursing aids, Retail, Property Services • Mostly Rent • HH Income $35,000-$60,000 • Teachers, First Responders • 2/3rd Rent, 1/3rd Own • HH Income $60,000-$100,000 • Nurses, Managers, Supervisors • 1/3rd Rent, 2/3rd Own • HH Income $100,000+ • Mostly Own Categories created by Wasatch Front Regional Council for preliminary land use modeling 2015-2050.
Housing Demand by Household Income • HH Income Under $35,000 • Nursing aids, Retail, Property Services • Mostly Rent • HH Income $35,000-$60,000 • Teachers, First Responders • 2/3rd Rent, 1/3rd Own • HH Income $60,000-$100,000 • Nurses, Managers, Supervisors • 1/3rd Rent, 2/3rd Own • HH Income $100,000+ • Mostly Own Categories created by Wasatch Front Regional Council for preliminary land use modeling 2015-2050.
Housing Demand by Household Income • HH Income Under $35,000 • Nursing aids, Retail, Property Services • Mostly Rent • HH Income $35,000-$60,000 • Teachers, First Responders • 2/3rd Rent, 1/3rd Own • HH Income $60,000-$100,000 • Nurses, Managers, Supervisors • 1/3rd Rent, 2/3rd Own • HH Income $100,000+ • Mostly Own Categories created by Wasatch Front Regional Council for preliminary land use modeling 2015-2050.