Download
1 / 54
540 likes | 787 Vues
USACE Directory of Expertise for Risk & Reliability. USACE Asset Management Workshop. An Overview of Engineering Risk and Reliability Methods for USACE Studies David M. Schaaf, P.E. LRD Regional Technical Specialist Structural (Louisville District).

E N D
USACE Directory of Expertise for Risk & Reliability USACE Asset Management Workshop An Overview of Engineering Risk and Reliability Methods for USACE StudiesDavid M. Schaaf, P.E.LRD Regional Technical SpecialistStructural (Louisville District)
Overview of Engineering Risk & ReliabilityOutline of Presentation USACE Directory of Expertise for Risk & Reliability 1. What is Risk? What is Reliability? Why is it Used? 2. Engineering Reliability Modeling Characteristics 3. Acceptable Methods for Engineering Reliability 4. Basic Features of Reliability Modeling and Analysis 5. Consequence Event Trees 6. New Engineering Reliability Guidance 7. New USACE DX for Risk and Reliability
Five Required Elements of Risk USACE Directory of Expertise for Risk & Reliability • Likelihood – future uncertainty of an event • Outcome – link paired with likelihood in risk profile • Significance – amount of gain/loss for a particular outcome • Casual Scenario – causes of an event & subsequent outcome • Population – important aspect for life safety issues
Risk Assessment/Management USACE Directory of Expertise for Risk & Reliability Risk Assessment Determines: • Likelihood • Outcome • Causal Scenario • Population Risk Management Determines: • Significance • Course of Risk Aversion/Mitigation • Risk vs. Cost Tradeoffs
Reliability Analysis USACE Directory of Expertise for Risk & Reliability Reliability – probability that a system will perform its intended function for a specific period of time under a given set of conditions R = 1 - Pf Reliability is the probability that unsatisfactory performance or failure will not occur
Reliability Analysis USACE Directory of Expertise for Risk & Reliability Probability of Failure (Pf) – easily defined for recurring events and replicate components (such as light bulbs, etc…) Probability of Unsatisfactory Performance (PUP) • Tough to define for non-recurring events • Typically, USACE structural elements fall into this category for a variety or reasons • Examples (sliding of gravity structures, fatigue cracking of gates, etc…) • Many times can be classified as an “economic failure” when consequences are significant
Relationship Between Risk & Reliability USACE Directory of Expertise for Risk & Reliability Costs * PUP = Consequences Risk Annual probabilities computed from an engineering reliability model Cost Examples for USACE Projects Emergency Repairs Delay Times for Users Increased O & M Costs and/or Frequency Damages to Users Benefits Foregone Event Tree
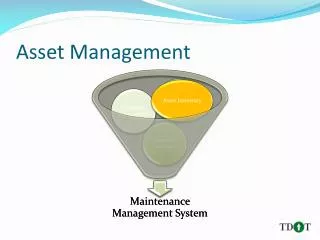
Reliability Modeling Basics USACE Directory of Expertise for Risk & Reliability Probabilistic Modeling the Current and Future Condition of Structures/Components for Decision Making Historical Information About Component • Previous Maintenance and Failures • Accounts for Historical Patterns and Future Condition Realizes Probabilistic Nature of Engineering Analysis Develop Probabilities of Unsatisfactory Performance for Components Over Period of Study
Reliability Analysis –Why is It Used? USACE Directory of Expertise for Risk & Reliability Analysis Tool Used by USACE to Prioritize Investments • Major Rehabilitation Studies • Dam Safety Portfolio Risk Assessment Recognizes and Captures Uncertainty in Analyses • Engineering Uncertainties – Loads, Material Properties, Corrosion, Fatigue, Stress Concentration Factors, Etc… • Economic Uncertainties – Traffic Forecasts, Rate Savings Shows Economic Justification and Risks Associated with Multiple Future Investment Alternatives • Fix-as-Fails Maintenance, Advance Maintenance, Major Rehab Allows a Method to Rank Projects Based Upon Risks Associated with Life Safety and Economics
Reliability Modeling CharacteristicsInvestment Tool for Decision Making USACE Directory of Expertise for Risk & Reliability • Measures the risk (life safety/$$$ damages) associated with performance of a component and/or system of components • Reliability model itself is just one piece of the overall analysis. Integrates with consequence analysis through event trees. • For an overall project, all critical components are analyzed to determine their performance through the study period (50 years for most USACE studies)
Aging Infrastructure PrioritizationNavigation ProjectsFlood Control ProjectsWhere are our biggest risks to life safety?What are greatest needs for navigation system? USACE Directory of Expertise for Risk & Reliability
USACE Navigation Projects – Aging Infrastructure • VITAL STATISTICS • 238 lock chambers • Average age = 58 years • Median age = 51 years • 46% over 50 years • 58% in next 10 years • Low hazard project • Significant hazard • High hazard project 50 years
USACE Flood Control Projects – Aging Infrastructure • VITAL STATISTICS • 400 flood control dams • Average age = 46 years • Median age = 44 years • 42% over 50 years • 67% in next 10 years • Low hazard project • Significant hazard • High hazard project 50 years
Acceptable Methods for Reliability Analysis USACE Directory of Expertise for Risk & Reliability
Engineering Reliability Analysis Currently Four Acceptable Methods in Guidance Reliability Index Method (Probabilistic Method) Uses Beta values to determine point estimates of reliability Not applicable for time dependent situations, issues w/ multiple random variables in the analysis Originally used when software and computational packages were limited Hazard Functions Analysis (Probabilistic Method) Preferred method using analytical models with Monte Carlo simulation Handles time dependency and multiple, correlated random variables State-of-the-art method used on ORMSS, Markland Rehab Study Historical Frequency of Occurrence / Survivorship Curves Best method but database of failures not available for civil works structures Applicable for other components, such as motors Expert Elicitation Process Uses judgment from a panel of experts to establish failure probabilities Only used to supplement analytical methods Note: On-going reliability guidance should supercede this guidance over next 2-3 years with an EC on USACE Infrastructure Engineering Reliability Analyses
Expert Elicitation Process USACE Directory of Expertise for Risk & Reliability Facilitator p(u) = .0003 p(u) = .0004 p(u) = .0007 p(u) = .008
Expert Elicitation Process USACE Directory of Expertise for Risk & Reliability Solicitation of “experts” to assist in determining probabilities of unsatisfactory performance or rates of occurrence Formal process with a facilitator, panel of experts, observers, and training period to remove bias and dominance Should be used to supplement analytical reliability models as part of an overall risk assessment for a project Recent project studies using expert elicitation • Nashville District (Chickamauga Lock Replacement Study) • Pittsburgh District (Ohio River Mainstem Study – Emsworth Lock) • Louisville District (Mill Creek Flood Protection Project) • Vicksburg District (Lindy C. Boggs Lock Wall Evaluation)
Historical Frequency Method USACE Directory of Expertise for Risk & Reliability Use of known historical information for records at site to estimate the failure rates of various components Excellent method, but usually USACE projects do not have enough historical failure performance to develop future probabilities Example: if you had 5 hydraulic pumps in standby mode and each ran for 2000 hours and 3 failed during standby mode, the failure rate would be as follows: Total standby hours = 5 * 2000 hours = 10,000 hours Failure rate (standby mode) = 3 / 10,000 = 0.0003 failures/hour
Manufacturer Survivorship Curves USACE Directory of Expertise for Risk & Reliability Excellent method that is very similar in nature to historical frequency method There are enough failures to develop survivorship curves for different components (light bulbs are an excellent example). These are usually provided by the manufacturer for items such as pumps, motors, etc… Same as historical frequency, USACE components typically do not have enough “failure” events to establish survivorship curves with the exception of some components at hydropower facilities (generators, etc…)
Probabilistic Methods USACE Directory of Expertise for Risk & Reliability Reliability Models Are: • defined by random variables and their underlying distributions • based upon limit states (analytical equations) similar to those used in design or analysis of a component • based upon capacity/demand or safety factor relationships Two Probabilistic Methods of Developing Reliability Models are Currently in Use within USACE: • Reliability Index (β Method) • Hazard Function Analysis
Reliability Index (β Method) Utilizes Taylor Series Finite Difference 1st order expansion about the mean value Linear approximation of second moment Uses a factor of safety approach Easy to implement in spread sheets x µ (C-D) Measure of how far the mean value for safety margin is from the limit state threshold Demand (C-D) 0.0 Safety Margin (C-D)
Reliability Index (β Method) Major Shortcomings Associated with βMethod: • Instantaneous that represents “snapshot” in time and is not applicable for time dependent structures whose conditions degrade with time • Only applicable for a few distribution types and not efficient when there are many random variables and when some are correlated with one another • Many times errors made on underlying distributions used to calculate β • Originally used when computation power and commercial software was not adequate for simulation model development
Hazard Function Analysis USACE Directory of Expertise for Risk & Reliability Preferred Method of Computing Probabilities of Failure • Started with insurance actuaries in England in late 1800’s • Brought into engineering field with aerospace industry in 1950’s • Accounts for the knowledge of the past history of component Computes the Rate of Change at Which the Probability Changes Over a Selected Time Step (Usually Annually) • Not a “snapshot” in time, it is truly cumulative • Uses Monte Carlo simulation techniques to calculate the true probability of failure (or PUP) • Can easily be developed for time dependent and non-time dependent models from deterministic engineering design procedures
Hazard Function Analysis USACE Directory of Expertise for Risk & Reliability Definition: The hazard function, h(t), is the conditional probability of unsatisfactory performance of a structure or component at time t given that it has survived up to the selected time h(t) = f(t) / R(t) where: f(t) = pdf at time t + Δt R(t) = cumulative reliability up to time t When using Monte Carlo simulation methods it can be simplified to the following formula: h(t) = # of failures (ti) / # of survivors (ti-1)
Summary of Probabilistic Methods USACE Directory of Expertise for Risk & Reliability For Components Whose Reliability will not Degrade with Time (Non-Time Dependent Reliability Analysis): • Linear limit states with normal or lognormal input distribution types – Reliability Index (β Method) or Monte Carlo simulation methodology is appropriate • Non-linear limit states – Monte Carlo simulation methodology • Typical USACE examples: gravity structures w/o changing loads For Components Whose Reliability Degrades with Time (Time Dependent Reliability Analysis): • Hazard function analysis using Monte Carlo simulation methodology • Typical examples: hydraulic steel structures, deteriorating concrete, anchored walls, mechanical/electrical equipment, etc…
Basic Features of Reliability Analysis USACE Directory of Expertise for Risk & Reliability
Basic Parts to a Reliability Analysis • Limit State which is the failure mechanism that is being investigated such as stability of gravity structures or fatigue analysis for steel structures • Random Variables which are input values for the analysis that are allowed to vary according to some distribution. Example might be yield strength of steel, corrosion rate... • Constants are input values to model that hold the same value for each iteration such as unit weight of water, etc. • Counter which tabulates iterations that reach the limit state (or fail) versus those that never fail. Used to track the number of failures and survivors for each time period analyzed. • Event Tree which is developed to show randomness associated with different levels of repair given a failure. This is developed separate of the reliability model and is provided to depict the consequences associated with unsatisfactory performance.
Required Info for Consequence Analysis USACE Directory of Expertise for Risk & Reliability Annual Hazard Rate (Time Dependent Components) Single PUP (Non-Time Dependent Components) Consequence Event Tree for Each Component/Scenario • Only evaluate significant consequences • Various level of repairs • Cost to repair & other damages (time out of service, etc…) Updated Hazard Rate for Repaired Components Consequences Associated with Schedule Repair Prior to Failure to Compare vs. Fix-As-Fails Scenario
Engineering RequirementsReliability Modeling – Outputs and Integration with Economics Time dependent probabilities of failure for various alternatives through study period Consequence event tree given the limit state is exceeded in the reliability analysis
USACE Directory of Expertise for Risk & Reliability Consequence Event Trees
Consequence Event TreesBackground Information USACE Directory of Expertise for Risk & Reliability • Mechanism That Interfaces Engineering and Consequences • Provides Consequences (Repair Cost, Service Disruption Time, Etc.) Associated with Unsatisfactory Performance of Component • Critical to Overall Consequence Evaluation for Loss of Life and Economic Damages • Information Developed Consistent with Reliability Limit State Modeling • Developed for Individual Maintenance Strategies
Consequence Event TreeBasic Parts EVENT FREQUENCY -- Determined for each load case being evaluated RELIABILITY MODEL INPUT -- Given the event occurs, what is the probability of unsatisfactory performance? RANGE OF FAILURE -- Given limit state being modeled, what are the possible levels of failure given that it occurs? CONSEQUENCES OF FAILURE -- For each level of failure, what are the expected & REQUIRED REPAIR consequences (loss of life, $$$ damages)? EFFECT ON FUTURE RELIABILITY -- Following the repair, what is the improved reliability for future operations?
Consequence Event TreesExample Format Branch 1 Branch 2 Branch 3 Branch 4 (1-PUP #1) % Repair Level #1 % Consequence #1 Reliability Upgrade Level #1 Load Case #1 % Time PUP #1 % Reliability Upgrade Level #2 Repair Level #2 % Consequence #2 (1-PUP #2) % Repair Level #3 % Consequence #3 Reliability Upgrade Level #3 Load Case #2 %Time PUP #2 % Repair Level #4 % Consequence #4 Reliability Upgrade Level #4 Scheduled Repair/Replacement – Cost and Service Disruption Time
Consequence Event TreesReview of Key Points USACE Directory of Expertise for Risk & Reliability • Links Reliability Analysis to Consequence Evaluation Through Multiple Alternative Scenarios • Consequences Consistent with Limit State Being Modeled in Reliability Analysis • Significant Limit States/Consequences Effect Evaluation • Expert Elicitation is a Good Means to Obtain Event Tree Values when Analytical Methods or Historical Performance is not Available
Planning Requirements for Major Rehab Multi-Scenario Planning Options – Establishing the WOPC Key – establish the base condition Base condition should be calibrated to current field conditions Deterioration modeling without reliability upgrade repairs What is future cost to keep project serviceable? What is future reliability? Advance maintenance repair scenarios Short-term repair to temporarily upgrade reliability What is the cost of repair? Service disruption time? Upgraded reliability? Compare to the baseline plan Plan with the Highest Net Benefits Determines Optimized WOPC Developing the With Project Condition Replacement or long-term repair that provides substantial increase in reliability for the long-term performance of the structure Repair/replacement must meet Major Rehab cost and time thresholds Compared to optimized WOPC to determine if it is economically justified
Economic AnalysisIncremental Benefits w/o Reliability-Based Consequences USACE Directory of Expertise for Risk & Reliability
Economic AnalysisIncremental Benefits with Reliability-Based Consequences USACE Directory of Expertise for Risk & Reliability
USACE Directory of Expertise for Risk & Reliability New Engineering CircularEngineering Reliability Guidancefor Existing USACE Civil Works Infrastructure
New Engineering Reliability GuidanceGeneral Background USACE Directory of Expertise for Risk & Reliability Updating engineering reliability guidance sorely needed No systematic guidance that addresses development of other critical pieces of analysis such as event trees and integration within engineering guidance Currently, major rehab guidance document (EP 1130-2-500) is the general reliability guidance that has been used, but it is very old and has some outdated information Major rehab guidance will reference the EC document as the “source to use” for developing engineering reliability analysis
New Engineering Reliability GuidanceStructural Guidance Currently, there is no structural reliability guidance since previous documents have been rescinded Previous structural guidance has been rescinded due to more accurate, analytically correct techniques (Monte Carlo simulation) available with commercial software and PC speed Rescinded structural guidance • ETL 1110-2-321 “Reliability Assessment of Navigation Structures and Stability of Existing Gravity Structures” • ETL 1110-2-354 “Reliability of Pile-Founded Navigation Structures” • ETL 1110-2-532 “Reliability Assessment of Navigation Structures”
New Engineering Reliability GuidanceExisting Geotechnical Guidance Currently, there are two active geotechnical reliability documents although the main sections of these will be rolled into the new EC document in order to have a single source Currently active geotechnical guidance • ETL 1110-2-547 covers basic reliability applications for geotech engineering • ETL 1110-2-561 covers seepage and slope stability reliability applications for embankment dams New EC will cover recent developments associated with potential time dependent aspects of seepage & piping reliability Expired geotechnical guidance • ETL 1110-2-556 covered reliability assessment of levees
New Engineering Reliability GuidanceExisting Mechanical/Electrical Guidance Currently, there is one active document related to mechanical and electrical reliability assessments for hydropower projects (ETL1110-2-550) -- uses survivorship curves Recently mechanical/electrical guidance (expired June 2006) • ETL 1110-2-560 covers basic reliability applications for mechanical and electrical aspects of navigation locks and dams • Overall, the methodology is appropriate, but there are some major changes than need to be made (minor components and failure rate problems) • Application using these methods had to be used with extreme caution Current plan for mechanical/electrical guidance • USACE team of mech/elec engineers, along with reliability experts, will develop applicable failure rates for navigation lock and dam uses • Only critical components will be considered in the analysis • Goal is to have updated failure rates and improved method by end FY06 • These improvements will be rolled into the new EC document
New Engineering Reliability GuidanceGeneral Information USACE Directory of Expertise for Risk & Reliability Three Year Plan to Develop Infrastructure Reliability Guidance Engineering Circular (EC) Initial funds received in FY04 to establish team, set general schedule, outline Guidance will cover all major engineering disciplines (structural, geotechnical, mechanical, electrical, as well as basic economic aspects) Integration with economics and plan formulation also included Technical Team Spread throughout USACE New Guidance Needs to be Incorporated in Major Rehab Evaluation Guidance with Respect to Engineering Requirements as well as Other Uses (Systems Studies, Evaluation of Existing Deteriorated Structures)
New Engineering Reliability GuidanceMarch 2005 Progress Review Meeting w/ HQ FY05 Funds Received in February Limiting Much Progress During First ½ of FY Progress Review Meeting with HQ in March 2005 Refined Outline as Per April 2004 Meeting Used as Guide Major Portions of Following Main Volume Completed: Chapter 1 – Introduction and Background Chapter 3 – Engineering Reliability Guidelines Chapter 5 – Engineering and Economic Integration Refocus Document to be More Business Line/Project Oriented Previous version from FY04 was separated by discipline
New Engineering Reliability GuidanceMajor Changes Out of March 2005 Meeting Personnel at Meeting Approved Idea with Following Taskers from that Meeting Create New Technical Appendices on Project/Business Line Basis Determine Appropriate POC’s to Lead These Appendices Revise Main Volume Outline to Pull in General Discussions Regarding Reliability Analysis for Select Disciplines New Technical Appendices and Technical Leads Navigation Appendix (David Schaaf, Louisville) Flood Protection Appendix (Robert Patev, New England) Hydropower Appendix – (James Nolan, former USACE from HDC) Coastal and Port Structures – (Dr. Jeff Melby, ERDC-WES) Technical Appendices to Contain Practical Examples/Case Studies Refine Main Volume Sections to Includes General Discipline Guidance
New Engineering Reliability GuidanceCurrent Status of Document Outline for Main Volume 1. Introduction & Background (purpose, history, on-going initiatives) 2. Engineering Reliability Guidelines (load cases, criteria analysis) 3. Methodologies for Reliability Analysis (available methods, model set-up) 4. Expert Elicitation Methodology (general overview, when to use) 5. Systems Reliability Applications (component redundancy, parallel, series) 6. Engineering & Economic Integration (event trees, base condition) 7. Risk & Reliability for USACE Studies (major rehab, systems studies) 8. Integration with USACE Dam Safety Program (portfolio risk analysis) 9. Risk and Reliability Issues for Navigation Locks & Dams 10. Risk and Reliability Issues for Flood Control Projects 11. Risk and Reliability Issues for Hydropower Projects 12. Risk and Reliability Issues for Coastal/Port Structures 13. Guidelines for Report Writing 14. References
New Engineering Reliability GuidanceCurrent Status of Document Outline for Navigation Lock and Dam Appendix 1. Land Lock Wall Stability Reliability Analysis Example (ORMSS) 2. Approach Wall Stability Reliability Analysis Example (ORMSS) 3. Simplified Hydraulic Steel Structure Reliability Example (GLSLS) 4. HF Miter Gate Reliability Analysis Example (Markland Major Rehab) 5. Mass Concrete Deterioration Reliability Example (Chickamauga) 6. Concrete Stilling Basin Scour Example (J.T. Myers Major Rehab) 7. Miter Gate Machinery Reliability Analysis Example (ORMSS) 8. Lock Electrical Systems Reliability Analysis Example (ORMSS) Appendix Examples Have Complete Process of Model Development Including: Selection of Modeling Features (Random Variables, Constants, Etc…) Development of Applicable Limit State Reliability Model Output and Interpretation Development of Consequence Event Tree Economic Analysis Summary of Results
New Engineering Reliability GuidanceCurrent Status of Document Outline for Flood Control Appendix 1. Embankments and Levee Examples a. Hodges Village Dam Major Rehab Study b. Wolf Creek Dam Major Rehab Study 2. Outlet Works for Flood Control Projects a. Corrosion/Fatigue of Gates b. Performance of Conduits 3. Concrete Structures for Flood Control Projects a. Erosion of Spillways b. Alkali Aggregate Reaction 4. M/E Equipment for Flood Control Projects a. Reliability Block Diagrams (Wolf Creek) b. Fault Tree Analysis (Wolf Creek)
New Engineering Reliability GuidanceCurrent Status During FY06, Main Personnel Developing Document Redirected to Katrina Work Others working on guidance heavily involved with Dam Safety SPRA Originally Scheduled for Draft EC by 30 Sep 06 May Have Slight Extension into FY07 to Wrap Up Draft Document Handing Off to A/E or Others Not the Best Option for Completing a Comprehensive EC that Meets Intended Need