Download
1 / 48
490 likes | 541 Vues
Learn the importance of inventory control, safeguarding methods, cost flow assumptions impact on financial statements, and various costing methods.

E N D
6 Inventories Student Version
1 Describe the importance of control over inventory. 6-2
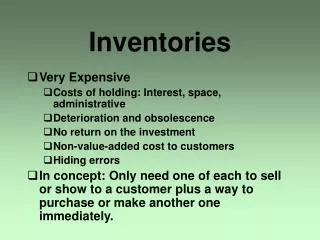
1 Safeguarding Inventory Two primary objectives of control over inventory are: • Safeguarding the inventory, and • Properly reporting it in the financial statements.
1 Safeguarding Inventory • The purchase order authorizes the purchase of the inventory from an approved vendor. • The receiving report establishes an initial record of the receipt of the inventory. • The amount of inventory is always available in the subsidiary inventory ledger.
2 Describe the three inventory cost flow assumptions and how they impact the income statement and balance sheet. 6-5
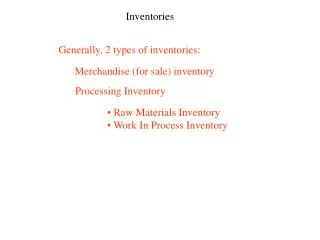
2 Inventory Cost Flow Assumptions Under the first-in, first out (FIFO)inventory cost flow method, the first units purchased are assumed to be sold and the ending inventory is made up of the most recent purchases.
2 Inventory Cost Flow Assumptions Under the last-in, first out (LIFO)inventory cost flow method, the last units purchased are assumed to be sold first and the ending inventory is made up of the first units purchased.
2 Inventory Cost Flow Assumptions Under the average inventory cost flow method, the cost of the units sold and in ending inventory is an average of the purchase costs.
3 Determine the cost of inventory under the perpetual inventory system, using the FIFO, LIFO, and average cost methods. 6-9
3 First-In, First-Out Method On January 1, the firm had 100 units of Item 127B that cost $20 per unit. Item 127B Units Cost Jan. 1 Inventory 100 $20
3 First-In, First-Out Method On January 4, the firm sold 70 units of 127B at $30 each. Item 127B Units Cost Jan. 1 Inventory 100 $20 4 Sale 70
Exhibit 3 3 Entries and Perpetual Inventory Account (FIFO)
3 First-In, First-Out Method On January 10, the firm purchased 80 units at $21 each. Item 127B Units Cost Jan. 1 Inventory 100 $20 4 Sale 70 10 Purchase 80 21
Exhibit 3 3 Entries and Perpetual Inventory Account (FIFO) (continued) 10 Merchandise Inventory 1,680 Accounts Payable 1,680 Date Jan. 1
3 First-In, First-Out Method On January 22, the firm sold 40 units for $30 each. Item 127B Units Cost Jan. 1 Inventory 100 $20 4 Sale 70 10 Purchase 80 21 22 Sale 40
Exhibit 3 Date Jan. 1 3 Entries and Perpetual Inventory Account (FIFO) (continued)
3 First-In, First-Out Method On January 28, the firm sold 20 units at $30 each. Item 127B Units Cost Jan. 1 Inventory 100 $20 4 Sale 70 10 Purchase 80 21 22 Sale 40 28 Sale 20
Exhibit 3 3 Entries and Perpetual Inventory Account (FIFO) (continued) Date Jan. 1
3 First-In, First-Out Method On January 30, purchased one hundred additional units of Item 127B at $22 each. Item 127B Units Cost Jan. 1 Inventory 100 $20 4 Sale 70 10 Purchase 80 21 22 Sale 40 28 Sale 20 30 Purchase 100 22
Exhibit 3 3 Entries and Perpetual Inventory Account (FIFO) (continued)
Exhibit 3 3 Entries and Perpetual Inventory Account (FIFO) (concluded) January 31 inventory Cost of merchandise sold
3 Last-In, First-Out Method On January 1, the firm had 100 units of Item 127B that cost $20 per unit. Item 127B Units Cost Jan. 1 Inventory 100 $20
3 Last-In, First-Out Method On January 4, the firm sold 70 units of 127B at $30 each. Item 127B Units Cost Jan. 1 Inventory 100 $20 4 Sale 70
Exhibit 4 3 Entries and Perpetual Inventory Account (LIFO)
3 Last-In, First-Out Method On January 10, the firm purchased 80 units at $21 each. Item 127B Units Cost Jan. 1 Inventory 100 $20 4 Sale 70 10 Purchase 80 21
Exhibit 4 3 Entries and Perpetual Inventory Account (LIFO) (continued) 10 Merchandise Inventory 1,680 Accounts Payable 1,680 Date Jan. 1 4
3 Last-In, First-Out Method On January 22, the firm sold 40 units for $30 each. Item 127B Units Cost Jan. 1 Inventory 100 $20 4 Sale 70 10 Purchase 80 21 22 Sale 40
Exhibit 4 3 Entries and Perpetual Inventory Account (LIFO) (continued) Date Jan. 1 4
3 Last-In, First-Out Method On January 28, the firm sold 20 units at $30 each. Item 127B Units Cost Jan. 1 Inventory 100 $20 4 Sale 70 10 Purchase 80 21 22 Sale 40 28 Sale 20
Exhibit 4 3 Entries and Perpetual Inventory Account (LIFO) (continued) Date Jan. 1 4
3 Last-In, First-Out Method On January 30, the firm purchased one hundred additional units of Item 127B at $22 each. Item 127B Units Cost Jan. 1 Inventory 100 $20 4 Sale 70 10 Purchase 80 21 22 Sale 40 28 Sale 20 30 Purchase 100 22
Exhibit 4 3 Entries and Perpetual Inventory Account (LIFO) (continued) Date Jan. 1 4 10
Exhibit 4 3 Entries and Perpetual Inventory Account (LIFO) (concluded) Cost of Merchandise Sold January 31 Inventory
4 Determine the cost of inventory under the periodic inventory system, using the FIFO, LIFO, and average cost methods. 6-34
Exhibit 5 4 First-In, First-Out Flow of Costs
Exhibit 5 4 Last-In, First-Out Flow of Costs
4 Average Cost Method The weighted average unit cost is determined as follows: Total Cost of Units Available for Sale Units Available for Sale Average Unit Cost =
5 Compare and contrast the use of the three inventory costing methods. 6-38
5 Partial Income Statements First-In, First-Out Net sales $3,900 Cost of merchandise sold: Beginning inventory $2,000 Purchases 3,880 Merchandise available for sale $5,880 Less ending inventory 3,250 Cost of merchandise sold 2,630 Gross profit $1,270
5 Partial Income Statements Average Cost Net sales $3,900 Cost of merchandise sold: Beginning inventory $2,000 Purchases 3,880 Merchandise available for sale $5,880 Less ending inventory 3,150 Cost of merchandise sold 2,730 Gross profit $1,170
5 Partial Income Statements Last-In, First-Out Net sales $3,900 Cost of merchandise sold: Beginning inventory $2,000 Purchases 3,880 Merchandise available for sale $5,880 Less ending inventory 3,050 Cost of merchandise sold 2,830 Gross profit $1,070
6 Describe and illustrate the reporting of merchandise inventory in the financial statements. 6-42
6 Cost Cost is the primary basis for valuing and reporting inventories in the financial statements. However, inventory may be valued at other than cost in the following cases: (continued)
6 Valuation at Lower of Cost or Market • The cost of replacing items in inventory is below the recorded cost. • The inventory cannot be sold at normal prices due to imperfections, style changes, or other causes.
6 Valuation at Lower of Cost or Market Market, as used in lower of cost or market, is the cost to replace the merchandise on the inventory date.
Exhibit 8 6 Determining Inventory at Lower of Cost or Market
6 Valuation at Net Realizable Value Merchandise that is out of date, spoiled, or damaged should bewritten down to its net realizable value. This is the estimated selling price less any direct cost of disposal, such as sales commissions.