INVENTORIES
INVENTORIES. STUDY OBJECTIVES After studying this chapter, you should understand:. CLASSIFYING INVENTORY. For manufacturers, inventory has three distinct categories. . INVENTORY. RAW MATERIALS. WORK IN PROCESS. FINISHED GOODS. STUDY OBJECTIVE 1 DETERMINING INVENTORY QUANTITIES.

INVENTORIES
E N D
Presentation Transcript
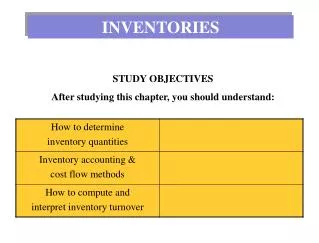
INVENTORIES STUDY OBJECTIVES After studying this chapter, you should understand:
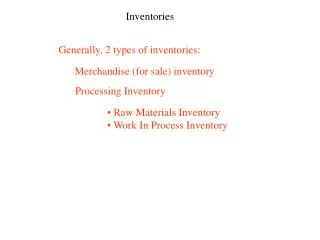
CLASSIFYING INVENTORY For manufacturers, inventory has three distinct categories. INVENTORY RAW MATERIALS WORK IN PROCESS FINISHED GOODS
STUDY OBJECTIVE 1 DETERMINING INVENTORY QUANTITIES At the balance sheet date, companies must determine how many units are on hand, and value those units. Two steps are required to achieve this: 1. Take a physical inventory count 2. Determine ownership of goods
INTERNAL CONTROLS FOR PHYSICAL INVENTORY Proper internal control over inventory can be achieved by the implementing the following procedures:
INVENTORY COSTING – PERIODIC SYSTEM Pool of Costs Cost of Goods Available for Sale Beginning inventory $ 20,000 Cost of goods purchased 100,000 Cost of goods available for sale $120,000 Step 1 Step 2 Ending Inventory Cost of Goods Sold Unit Total Cost of goods available for sale $120,000 Units Cost Cost Less: Ending inventory 15,000 5,000 $ 3.00 $15,000 Cost of goods sold $105,000
SPECIFIC IDENTIFICATION Tracks actual flow of goods. Each item marked with its unit cost. Inventory Purchases Cost of Goods Sold $1,500 Item 1 $700 SOLD Item #2 $750 1 Item #3 $800 SOLD
ASSUMED COST FLOW METHODS These methods assume cost flows that may be unrelated to the actual physical flow of goods. FIFO LIFO AVERAGE COST These cost flow assumptions do not have to be consistent with the actual flow of goods.
FIFO FIRST-IN, FIRST-OUT • Earliest goods purchased are the first to be sold. • Cost of earliest goods purchased are the first to be recognized as cost of goods sold. • Ending inventory consists of items purchased late in the year. FIFO ASSUMPTIONS
ALLOCATION OF COSTS FIFO METHOD 12,000 Step 1 Step 2 Ending Inventory Cost of Goods Sold Unit Total Date Units Cost Cost 11/27 400 $ 13 $ 5,200 Cost of goods available for sale $ 12,000 08/24 50 12 600 Less: Ending inventory 5,800 450 $5,800 Cost of goods sold $6,200
COGS PROOF FIFO METHOD 100 $ 10 $ 1,000 200 11 2,200 250 12 3,000 550 $ 6,200 The accuracy of the cost of goods sold can be verified by recognizing that the first units acquired are the first units sold. Unit Total Date Units Cost Cost 01/01 X = 04/15 X = 08/24 X = Total
REVIEW QUESTION FIFO METHOD In a period of rising prices, will FIFO will produce a higher or lower net income than LIFO? Why? Answer: FIFO will produce a higher net income when prices are rising because cost of goods sold is made up of items purchased early in the year at lower prices.
LIFO LAST-IN, FIRST-OUT • Latest goods purchased are the first to be sold. • Cost of latest goods purchased are the first to be recognized as cost of goods sold. • Ending inventory consists of items purchased early in the year. LIFO ASSUMPTIONS
ALLOCATION OF COSTS LIFO METHOD $12,000 Step 1 Step 2 Ending Inventory Cost of Goods Sold Unit Total Date Units Cost Cost 01/01 100 $ 10 $ 1,000 04/15 200 11 2,200 Cost of goods available for sale $ 12,000 08/24 150 12 1,800 Less: Ending inventory 5,000 450 $5,000 Cost of goods sold $7,000
Unit Total Date Units Cost Cost 11/27 X = X = 08/24 Total COGS PROOF LIFO METHOD 400 $ 13 $ 5,200 150 12 1,800 550$ 7,000 The cost of the last goods in are the first to be assigned to cost of goods sold. Under a periodic inventory system, all goods purchased during the period are assumed to be available for the first sale, regardless of the date of purchase.
REVIEW QUESTION LIFO METHOD In a period of rising prices, will LIFO will produce a higher or lower ending inventory than FIFO? Why? Answer: LIFO will produce a lower ending inventory than FIFO when prices are rising because ending inventory is made up of items purchased early in the year at lower prices.
AVERAGE COST • Goods available for sale are homogeneous. • Cost of goods available for sale is allocated on the basis of the weighted average unit cost incurred. • The weighted average unit cost is applied to the units on hand to determine the cost of ending inventory. AVERAGE COST ASSUMPTIONS
ALLOCATION OF COSTS AVERAGE COST $ 12,000 $ 5,400 $ 6,600 Step 1 Step 2 Ending Inventory Cost of Goods Sold $ 12,000 ÷ 1,000 = $12.00 Unit Total Cost of goods available for sale $ 12,000 Units Cost Cost Less: Ending inventory 5,400 450 x $ 12.00 = Cost of goods sold
FINANCIAL STATEMENT & EFFECTS Cost of goods sold 4,000 (200 x $20) 4,800 (200 x $24) Kralik Company purchases: January 10 200 units at $20 each December 31 200 units at $24 each Kralik Company sold 200 units at $30 each Cost of goods sold and gross profit under FIFO and LIFO are:
USE COST FLOW METHODS CONSISTENTLY • A company needs to use its chosen cost flow method consistently from one period to another. • Consistent application makes more comparable financial statements. • Changes in cost flow method should be disclosed in the financial statements.
INVENTORY DISCLOSURES Inventory is classified as a current asset in the balance sheet. COGS is subtracted from sales in the income statement. • Notes to financial statements should include: • Major inventory classes (if not on balance sheet) • Basis of accounting (Cost or LCM) • Costing Method (FIFO, LIFO, AVERAGE COST)
INVENTORY TURNOVER Measures the number of times on average the inventory is sold during a period. COGS INVENTORY TURNOVER = AVERAGE INVENTORY $198,747 = 7.79 times ($24,401 +26,612) / 2 = 365 / 7.79 = 47 days Average days to sell
COST FLOWS—PERPETUAL INVENTORY The product data shown below for Bow Valley Electronics will be used to explain perpetual inventory costing using two assumed cost flow methods: FIFO LIFO Bow Valley Electronics Z202 Astro Condensers Unit Total Date Explanation Units Cost Cost 01/01 Beginning inventory 100 $10 $ 1,000 04/15 Purchase 200 11 2,200 08/24 Purchase 300 12 3,600 11/27 Purchase 400 13 5,200 Total $ 12,000
PERPETUAL INVENTORY – FIFO Under FIFO,the cost of the earliest goods on hand prior to each sale is charged to cost of goods sold. Therefore, the cost of goods sold on September 10 consists of the units on hand January 1 and the units purchased April 15 and August 24. Date Purchases Sales Balance January 1 (100 @ $10) $1,000 April 15 (200 @ $11) $2,200 (100 @ $10) (200 @ $11) $3,200 August 24 (300 @ $12) $3,600 (100 @ $10) (200 @ $11) (300 @ $12) $6,800 September 10 (100 @ $10) (200 @ $11) $6,200 (50 @ $12) $600 (250 @ $12) November 27 (400 @ $13) $5,200 (50 @ $12) (400 @ $13) $5,800
PERPETUAL INVENTORY – LIFO Under the LIFO methodusing a perpetual system,the cost of the most recentpurchase prior to sale is allocated to the units sold. The cost of the goods sold on September 10 consists entirely of goods from the August 24 and April 15 purchases and 50 of the units in beginning inventory. Date Purchases Sales Balance January 1 (100 @ $10) $1,000 April 15 (200 @ $11) $2,200 (100 @ $10) (200 @ $11) $3,200 August 24 (300 @ $12) $3,600 (100 @ $10) (200 @ $11) (300 @ $12) $6,800 September 10 (300 @ $12) (200 @ $11) $6,300 (50 @ $10) $500 (50 @ $10) November 27 (400 @ $13) $5,200 (50 @ $10) (400 @ $13) $5,700
INVENTORY ESTIMATION – GROSS PROFIT METHOD • The gross profit method estimates the cost of ending inventory by applying a gross profit rate to net sales. • It is used in preparing monthly financial statements under a periodic system. • It should NOT be used in preparing the company’s financial statements at year-end. • The gross profit rate is assumed to remain constant from one year to the next.
INVENTORY ESTIMATION – RETAIL INVENTORY METHOD • When a store has many different types of merchandise at low unit costs, the retail inventory method is often used. • To use this method, a company’s records must show both the cost and retail value of the goods available for sale. • The major disadvantage of this method is that it is an averagingtechnique.