1 / 44

Data Classification and Symbolization

Data Classification and Symbolization. Data are plural. Datum is singular. Qualitative, Nominal data. Qualitative, Nominal Data. Quantitative Data Display. Choropleths : filled enumeration unit, such as a county or state or country

Télécharger la présentation

Data Classification and Symbolization

An Image/Link below is provided (as is) to download presentation Download Policy: Content on the Website is provided to you AS IS for your information and personal use and may not be sold / licensed / shared on other websites without getting consent from its author. Content is provided to you AS IS for your information and personal use only. Download presentation by click this link. While downloading, if for some reason you are not able to download a presentation, the publisher may have deleted the file from their server. During download, if you can't get a presentation, the file might be deleted by the publisher.

E N D

Presentation Transcript


  1. Data Classification and Symbolization

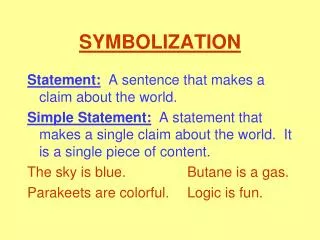
  2. Data are plural Datum is singular

  3. Qualitative, Nominal data

  4. Qualitative, Nominal Data

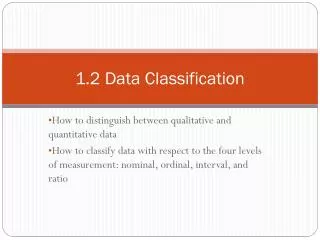
  5. Quantitative Data Display • Choropleths: filled enumeration unit, such as a county or state or country • Isopleths (Isolines): Lines connect points of equal value, such as elevation or barometric pressure • Graduated Symbols: Symbols are constructed to represent a range of data • Dots: Have consistent dot size and value

  6. Ordinal Choropleth Map

  7. Quantitative Graduated CirclesNot Standardized

  8. Same data, 4 Symbolizations

  9. Population DataCounty Level: Standardized Choropleths show population densityState Level: Non-Standardized Choropleths & Graduated Symbols show millions of people

  10. Dot size • Dot value • A value too small • C size too small • D size too big • B size & value just right

  11. Population distribution in US

  12. Dots and Graduated Circles

  13. Same data, classed two ways

  14. Not Standardized

  15. Same Data: A. Raw numbersB. & C. Measured against population (standardized)

  16. Same Data, classed 6 ways

  17. Flow Lines are another kind of isoline

  18. Color

  19. A. Mixed colors are confusing B. Hues of the same color are easy to understand

  20. Sports IllustratedSports Atlas12/27/04

  21. Hurlers Sluggers

  22. Cartograms

  23. Golf in area & per capita

More Related