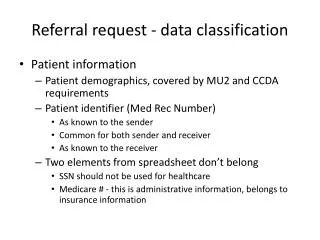
DATA CLASSIFICATION
DATA CLASSIFICATION. Qualitative Data consist of attributes, labels, or non-numerical entries. Example : color of cars, T-shirt size (S, M, L XL), class (freshman, sophoshmores, juniors, seniors, superseniors) Quantitative Data consist of numerical measurements or counts.


DATA CLASSIFICATION
E N D
Presentation Transcript
Qualitative Data consist of attributes, labels, or non-numerical entries. Example: color of cars, T-shirt size (S, M, L XL), class (freshman, sophoshmores, juniors, seniors, superseniors) Quantitative Data consist of numerical measurements or counts. Example: quiz grades, GPA, money
What type of data is phone numbers? What about zip codes? Driver license numbers?
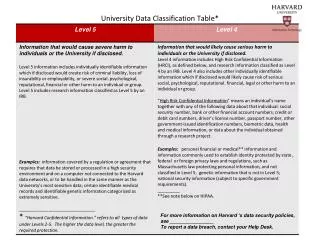
DATA can be classified according to the level of measurement: Data at the nominal levelof measurement are qualitative data only. No mathematical computations can be made at this level. Example: • SEC, ACC, PAC 12, BIG 10 • WIS, WLTX, WOLO, WACH We can not put the data in any order.
Data at the ordinal levelof measurement are qualitative or quantitative. Data at this level can be arranged in order, but differences between data entries are not meaningful. Example: Top 10, Box Office. - There is a classification, but the difference between two consecutive places is not consistent
Data at the interval level of measurement are quantitative. The data can be ordered and you can calculate meaningful differences between data entries. A zero entry represents a position on a scale, is not inherent. (0° C) Example: temperature scale, time line. - The difference between two consecutive places is consistent, and a 0 data doesn’t mean the absence of data
Data at the ratio level of measurementare similar to data at the interval level, with the added property that a zero entry is an inherent zero. A ratio of two data can be formed. ($0 in your account) Example: no negative data, GPA, salary. - The ratio has meaning compared to interval data, and a 0 data means the absence of data (0 inches of rain fall means NO rain)