Download
1 / 25
250 likes | 378 Vues
Internet Use and Broadband Adoption in Taiwan: An Overview Report January 200 4. APIRA conference August 19-20, 2004. Survey conducted by Survey & Statistics Analysis Research & Consultancy Center, Fu Jen Catholic University, commissioned by Taiwan Network Information Center. Outline.

E N D
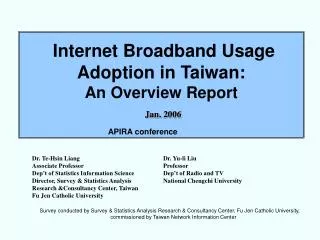
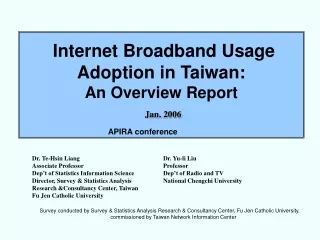
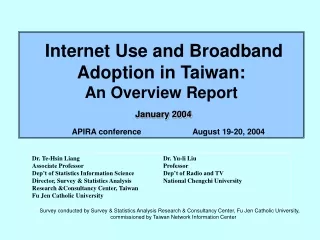
Internet Use and Broadband Adoption in Taiwan:An Overview ReportJanuary 2004 APIRA conferenceAugust 19-20, 2004 Survey conducted by Survey & Statistics Analysis Research & Consultancy Center, Fu Jen Catholic University, commissioned by Taiwan Network Information Center
Outline 1. Methodology 2. Estimated Number and Percentage of Internet Users 3. Estimated Number and Percentage of Broadband Users 4. Analysis on the Behaviors of Broadband Users 5. Analysis on the Behaviors of Broadband Users
Survey Time Jan. 6 to Feb. 8, 2004 Sample Number Valid samples 3,197 Target age 12 or above Population 23 Cities/Counties in Taiwan with 6,456,662 households Survey Computer Assisted Telephone Interviewing Survey Sampling Method Stratified simple random sampling. Estimate Method MMethod for Estimating the Total Number of Population: Three variables, cities/areas, gender and age groups are used for weighting the random stratified samples of interviewees of age 12 or above in Taiwan. The sample is based upon a total of 19,009,963 residents. MMethod for Estimating the Total Number of Household: Two variables, cities/areas and the number of members, in the household are used for weighting the random stratified samples. Methodology
Estimated Number and Percentage of Internet Users Estimated Number of Internet Users in Taiwan
Growth of Internet Users in Taiwan 7.5% Estimated Number and Percentage of Internet Users (continued) Age 0-100 Mar 2003 Age 0-100 Jul 2003 Age 0-100 Jan 2004 Age 15 or above Sept 2002 Age 15 or above Jan 2001 *Unit:Million Source:TWNIC Survey, & The Statistics Department of the Ministry of Transportation & Communication
(±2.70) (±6.73) (±3.48) (±3.16) (±3.68) (±7.54) (±3.06) (±5.78) Estimated Number and Percentage of Internet Users (continued) Percentages of Internet Users in Different Areas of Taiwan *Digits in the parenthesis is the Sampling Error: %
(±2.70) (±6.73) (±3.48) (±3.16) (±3.68) (±7.54) (±3.06) (±5.78) Estimated Number and Percentage of Broadband Users Percentages of Broadband Users in Different Areas of Taiwan *Digits in the parenthesis is the Sampling Error: %
Estimated Number and Percentage of Internet Households Percentages of Households in Taiwan with Internet Access 71.58% *Sampling Error:±1.73%(Confidence level 95%)
(±2.70) (±6.73) (±3.48) (±3.16) (±3.68) (±7.54) (±3.06) (±5.78) Estimated Number and Percentage of Internet Households (continued) Percentages of Households with Internet Access in Different Areas in Taiwan *Digits in the parenthesis is the Sampling Error: %
(±2.70) (±6.73) (±3.48) (±3.16) (±3.68) (±7.54) (±3.06) (±5.78) Estimated Number and Percentage of Broadband Subscribers Users Percentages of Household of Broadband Subscribers in Different Areas in Taiwan *Digits in the parenthesis is the Sampling Error: %
Analysis on the Behaviors of Broadband Users Gender Difference in Broadband Users 51.66% 43.25%
Analysis on the Behaviors of Broadband Users (continued) Percentages of Broadband Users in Different Age Groups 81.55% 77.55% Age16-20 9.47% Age21-25 Age65+
Analysis on the Behaviors of Broadband Users(continued) Venues where Broadband Users Get Online (multiple choices) 88.41% At home 28.15 at work places 21.59% at school 16.65 At internet caf’e
Analysis on the Behaviors of Broadband Users (continued) Amount of Time Broadband Users Spent Online 42.10% Spend more than 1 hours & Less than 3 hours on line
Analysis on the Behaviors of Broadband Users (continued) Favorite Time Slot for Using Broadband (Multiple Choices) 36.57% get online at 8pm-9pm 37.14% get online at 9pm-10pm ON line peak time 8Pm – 00Am 32.31% get online at 10pm-11pm
Analysis on the Behaviors of Broadband Users (continued) Purposes for Individual Broadband Users (Multiple Choices) Browse web pages ( 61.80%) E-mail (58.75%) Online game(20.83%)
Analysis on the Behaviors of Broadband Users (continued) Factors Considered in Choosing ISP (Multiple Choices) Cost (Price) (29.38%) Speed (26.62%)
Analysis on the Behaviors of Broadband Users (continued) Preferred Options for Broadband 68.91% ADSL
Analysis on the Behaviors of Broadband Users (continued) (2) Among the ADSL subscribers, 74.23% of them subscribe from Hinet. Supplier Analysis for ADSL Subscribers HINET 74.23%
Analysis on the Behaviors of Broadband Users (continued) Supplier Analysis for Cable Modem Subscribers Eastern Broadband Telecom 68.33%
Analysis on the Behaviors of Broadband Users (continued) Average Expenditures on Broadband 751-1000 NTD (25-35 USD) 25.99% 751-1250 NTD (25-40 USD) 49.51% + 1001-1250 NTD (35-40 USD) 23.52%
Analysis on the Behaviors of Broadband Users (continued) Reasonable Range for Broadband Expenditures 501-750 NTD (15-25 USD) 14.56% 501-750 NTD (15-30 USD) 28.19% + 751-1000 NTD (25-35 USD) 13.63%
Analysis on the Behaviors of Broadband Users (continued) Satisfaction with ISP 57.28% Satisfied with ISP
Analysis on the Behaviors of Broadband Users (continued) Problems for Using Broadband (Multiple Choices) Speed is too slow (30.99%) Instable (24.63%)