GST
(x 10 -4 ). (x 10 -3 ). P450. GST. 12. 3. 2. 8. 1. 4. 0. 0. WT mock. WT. #15. WT mock. WT. #15. BTH. BTH. (x 10 -4 ). (x 10 -2 ). 20. 12. PR-1a. PR-1b. 15. 8. 10. 4. 5. 0. 0. WT mock. WT. #15. WT mock. WT. #15. BTH. BTH. (x 10 -2 ). 5. 1.5.

GST
E N D
Presentation Transcript
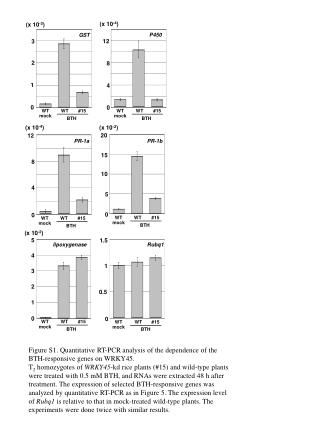
(x 10-4) (x 10-3) P450 GST 12 3 2 8 1 4 0 0 WT mock WT #15 WT mock WT #15 BTH BTH (x 10-4) (x 10-2) 20 12 PR-1a PR-1b 15 8 10 4 5 0 0 WT mock WT #15 WT mock WT #15 BTH BTH (x 10-2) 5 1.5 lipoxygenase Rubq1 4 1 3 2 0.5 1 0 0 WT mock WT #15 WT mock WT #15 BTH BTH Figure S1. Quantitative RT-PCR analysis of the dependence of the BTH-responsive genes on WRKY45. T2 homozygotes of WRKY45-kd rice plants (#15) and wild-type plants were treated with 0.5 mM BTH, and RNAs were extracted 48 h after treatment. The expression of selected BTH-responsive genes was analyzed by quantitative RT-PCR as in Figure 5. The expression level of Rubq1 is relative to that in mock-treated wild-type plants. The experiments were done twice with similar results.