Download
1 / 43
430 likes | 707 Vues
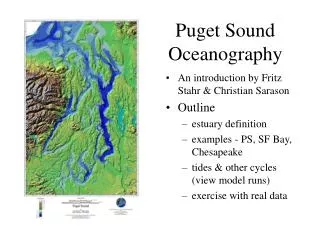
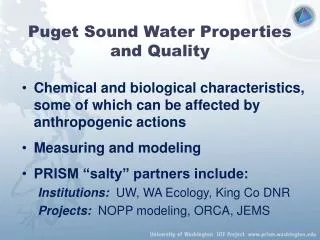
Puget Sound Water Properties and Quality. Chemical and biological characteristics, some of which can be affected by anthropogenic actions Measuring and modeling PRISM “salty” partners include: Institutions: UW, WA Ecology, King Co DNR Projects: NOPP modeling, ORCA, JEMS . Overarching Goal.

E N D
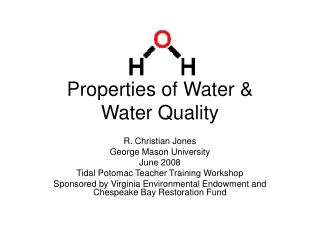
Puget Sound Water Properties and Quality • Chemical and biological characteristics, some of which can be affected by anthropogenic actions • Measuring and modeling • PRISM “salty” partners include: Institutions:UW, WA Ecology, King Co DNR Projects:NOPP modeling, ORCA, JEMS
Overarching Goal Through a strongly interacting combination of direct observations and computer models representing physical, chemical, and biological processes in Puget Sound, provide a record of Puget Sound water properties, as well as model now-casts and projections. The information will be used to develop a mechanistic understanding of the Sound’s dynamics, how human actions and climate influence these (e.g., “what-if scenarios”), and how, in turn, the water properties influence marine resources and ecosystem health (linkage with other PRISM elements).
Key questions • Understanding plankton dynamics in a temperate fjord: - What physical dynamics of water mass variation most influence stratification, and what is the phytoplankton response? - How important is nitrate versus ammonium in controlling phytoplankton production? - What controls light availability for phytoplankton in the euphotic zone? • Assessing ecosystem integrity: - Do salmon have food they need to survive? Is timing ok and what affects that? - What food-web shifts (e.g., macrozoops vs. gelatinous) affect fish etc survival? - How does an invasive species with certain growth/grazing characteristics impact food-web? • Understanding perturbation impacts (e.g., climate, human): - How does productivity differ with ENSO and PDO stages? - How does flushing differ with ENSO and PDO stages? - Do land-use practices affect water properties and phytoplankton?
Uses and benefits • The information will be used • for teaching at various levels • to promote and aid research • to help define effective regional planning • Public benefit includes: • Resource and habitat protection (e.g., clean water, fish, shellfish) • Waste/pollution planning and allocation • Puget Sound quality maintenance
PRISM – Puget Sound Water Properties – prime suspects • UW: Mark Warner, Al Devol, Steve Emerson, Miles Logsdon, Jeff Richey, Kate Edwards, Mitsuhiro Kawase • WA Ecology: Jan Newton, Rick Reynolds, Skip Albertson • KC-DNR: Randy Shuman, Bruce Nairn
Partnerships/ Monitoring Observations Virtual Puget Sound Remote sensing Climate variation impacts Modeling
Partnerships/ Monitoring Observations Virtual Puget Sound Remote sensing Climate variation impacts Modeling
Partnerships/ Monitoring Observations Virtual Puget Sound Remote sensing Climate variation impacts Modeling
Marine Water Quality Index Ships & Buoys
Partnerships/ Monitoring Observations Virtual Puget Sound Remote sensing Climate variation impacts Modeling
Marine Water Quality Index Ships & Buoys Remote sensing
Partnerships/ Monitoring Observations Virtual Puget Sound Remote sensing Climate variation impacts Modeling
Marine Water Quality Index Ships & Buoys El Niño vs La Niña Remote sensing
Partnerships/ Monitoring Observations Virtual Puget Sound Remote sensing Climate variation impacts Modeling
Marine Water Quality Index Ships & Buoys El Niño vs La Niña Remote sensing Aquatic biogeochemical cycling model
Marine Water Quality Index Ships & Buoys El Niño vs La Niña Remote sensing Aquatic biogeochemical cycling model
Partnerships/ Monitoring Observations Virtual Puget Sound Remote sensing Climate variation impacts Modeling
1. How are we measuring Puget Sound Water Properties and Quality? • PRISM-sponsored cruises • Partnership with WA Ecology and King Co monitoring (PSAMP) • JEMS: Joint Effort to Monitor the Strait, co-sponsored by MEHP, et al. • ORCA: Ocean Remote Chemical-optical Analyzer, initial sponsorship EPA/NASA, also WA SG, KC-DNR
PRISM cruises • Annual June and Dec. cruises; 10 so far • Greater Puget Sound including Straits • Synoptic hydrographic, chemical, and biological data • Input for models, student theses, regional assessments
Value of a PRISM cruise? • Student training and involvement • UG and G; majors and non-majors • Data collection on synoptic basis • verification for models • time-series at solstices • Involvement of larger community • media, K-12, other marine programs, local governments
PRISM cruise participation: • UW Undergraduates - 34 persons, 60 trips (41%) • Oceanography - 30 • Other Majors - 4 [UW Tacoma , Biochemistry, Computer Sci, Fisheries] • UW Grad Students- 21 persons, 23 trips (16%) • Oceanography - 11 • Other Majors - 10 [Chem, Geol, Appl Math, Biol, Genetics, Sci Ed, Foriegn] • WA State Dept. Ecology - 8 persons, 20 trips • UW Faculty - 4 persons, 13 trips • King County DNR - 4 persons, 5 trips • US Coast Guard Techs - 6 persons • Congressional Staff - 6 persons • Media - 4 persons Totals : 94 persons, 146 trips • UW Staff - 3 persons 57% student labor • CORE - 2 persons • NOAA/PMEL - 1 person • Ocean Inquiry Project - 1 person • High School Teacher - 1 person Data after 7 cruises:
PRISM Observations: Hood Canal Oxygen and Ammonium
Partnership:Ecology PSAMP monitoring • Analysis of monitoring data identified South Puget Sound as an area susceptible to eutrophication • Led to focused study on South Sound nutrient sensitivity (SPASM) • Coordination of SPASM and PRISM modeling/observ. http://www.ecy.wa.gov/
Partnership: KC-DNR’s WWTP siting • Region’s growth is requiring greater capacity to treat wastewater. New WWTP proposed. • KC MOSS study to site marine outfall and assess potential impacts • Coordinated modeling/ observ. effort with PRISM Marine outfall zones with depth contours http://www.metrokc.gov/
JEMSneed to know ocean boundary Compare Sept 2000 with Sept 2001: Temperature Why is there warmer fresher water in 2001 ?? Salinity
Cross-Channel Density Gradient Warmer fresher water drives stronger density gradient during Sep 2001 than in Sep 2000 North South
Geostrophic Velocity High River Flow Large Cross- Channel Gradient Increased Geostrophic Out Flow Decreased Residence Time 2000 drought had consequences…
1. Re: Puget Sound measurements • Good start and better coordination now • But, need more comprehensive views in time and space • Develop moorings, gliders, satellite and aircraft remote sensing • IOOS may help, but may not extend to estuaries
How are we modeling Puget Sound Water Properties and Quality? • “ABC” model: Aquatic Biogeochemical Cycling • NOPP partnership: • UW, WA Ecology, KC-DNR, OIP, Navy • Hub for models, data output, forum • Includes funds for sediment module, data management/assimilation, outreach/educ.
What is an Aquatic Biogeochemical Cycling Model and why develop one for PRISM? • Describes the dynamics of nutrients, plankton, and organic material in a water column; this has defining importance for water quality, food for higher trophic levels, and change impact projections. • Models commonly in use (e.g., EPA) take more of a curve-fitting approach, are composed of antiquated coding, and do not support teaching as well. • The model is an essential tool for exploring the fundamentals of biogeochemical cycling in Puget Sound, for use in planning or ”what-if” scenarios, and for use in teaching and communication.
Aquatic Biogeochemical Cycling Model: Features • Under active development (UW, WDOE, KCDNR) • Simulates three-dimensional concentrations of chemical and biological entities: • Dissolved oxygen and nutrients (NO3, PO4, NH4) • Phytoplankton biomass (three types) • Zooplankton biomass (three types) • Particulate and dissolved organic matter (C, N, P) • Externally forced by hydrodynamics and sunlight • Designed to interface with a variety of circulation models including POM, linkage to MM-5 and SWIM • Spatially explicit model based on published equations for biological and chemical reactions
Biogeochemical Systems Model rPOC rPON rPOP lPOC lPOP lPON DON DOC DOP O2 NO3 PO4 NH4 Z1ic Z2mac Z3gel P1flag P2dia P3nan
Aquatic Biogeochemical Cycling Model: Applications • Primary applications are to assess: • dynamics of phytoplankton blooms (eutrophic’n, HABs) • dynamics of dissolved oxygen and water quality • sensitivity to changes, both human (e.g., WWTP, climate change) and natural (e.g., ENSO, regime shift) • Suitable for both marine and freshwater systems • Supports linkages; will provide output to • nearshore sediment-biological model • higher trophic level models (e.g., salmon!) • Same tool can be used for teaching, basic research, applied research, and planning decisions.
Aquatic Biogeochemical Cycling Model: Status • Coded in C++ by Computer Science Honors UG • User-friendly web interface (GUI) allows easy model runs, storing coefficients • 1-cell model and web interface used and tested in graduate-level class Spring, 2000 • Coupled ABC to POM; testing coupled model in Budd Inlet against other model output and field data • Soon to be able to run coupled model from web • Working on visualization schemes for sections, time-series, and animations
Plan view of phytoplankton conc. in Budd Inlet 10 mmoles phyto C /m3 Northing (km) 1 1 3 Easting (km)
Northing (km) 1 9 0 Depth (m) 14 Longitudinal section of temperature in Budd Inlet degrees C
“A Partnership for Modeling the Marine Environment of Puget Sound, Washington”NOPP / PRISM • Develop, maintain and operate a system of simulation models of Puget Sound’s circulation and ecosystem, a data management system for oceanographic data and model results, and an effective delivery interface for the model results and observational data for research, education and policy formulation. • Develop fundamental understanding of the Sound’s working, and address questions raised by the regional community concerning management of the Sound and its resources.
2. Re: Puget Sound modeling • Good start and better coordination now • But, need completion of model integration (with POM et al.) and verification (with observational data and other models) • NOPP Modeling grant will help with model development, outreach, context
Our GOALS for 2002-3: • Continue time-series of observations • JEMS • PRISM cruises • ORCA • PSAMP • Extract more science from data collected so far • Database development and documentation • Further develop ABC Model • Improve operational status • Sophisticate ABC model integration with POM model • Use observational data for model verification • Continue work on Budd Inlet sub-model • Conduct coordinated observation/modeling project: MIXED • Outreach to schools, science community, and public
Goals for achieving VPS • Internal to ABC: • Sediment module • ABC needs directly: • POM (hydrodynamics) • DSHVM (river input) • MM-5 (weather forcings) • ABC can support: • Sediment/toxics transport and fate • Nearshore processes (NearPRISM) • Upper trophic levels (e.g., fish management) • HABs