Download

1 / 16
170 likes | 425 Vues
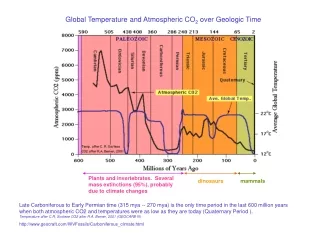
Global Temperature and Atmospheric CO 2 over Geologic Time. Plants and invertebrates. Several mass extinctions (95%), probably due to climate changes. dinosaurs. mammals.

E N D
Global Temperature and Atmospheric CO2 over Geologic Time Plants and invertebrates. Several mass extinctions (95%), probably due to climate changes dinosaurs mammals Late Carboniferous to Early Permian time (315 mya -- 270 mya) is the only time period in the last 600 million years when both atmospheric CO2 and temperatures were as low as they are today (Quaternary Period ). Temperature after C.R. Scotese CO2 after R.A. Berner, 2001 (GEOCARB III) http://www.geocraft.com/WVFossils/Carboniferous_climate.html
Famous warm spell when N. American glaciers melted, plants thrived (also called climatic optimum) Ice Age Famous cold spell named after Dryas octopetala, a rose-like flower found in arctic regions. Last major climate shift, and also happened abruptly. Fig. 14-3, p.376
“Maunder minimum” (number of sunspots) “Industrial revolution” N. Hemisphere was cooler than 1961-2000 average, but some areas like England were warmer than average Fig. 14-4, p.377
Note: when T increases, so does CO2; but what comes first – T or CO2? Fig. 14-10, p.386
Some natural causes for climate change: 1. Variation in solar output (less energy received by Earth = lower global T). Lower # sunspots = lower solar output and this seems to correlate with the Maunder minimum (they counted sunspots in the 1700’s, they did not measure solar energy) Fig. 14-13, p.390
Some natural causes for climate change: 2. Milankovitch Theory. Variation in eccentricity of Earth’s orbit (the further Earth is from the Sun the less energy received by Earth = lower global T) Fig. 14-8, p.384
Some natural causes for climate change: 2. Milankovitch Theory. Variation in precession of Earth’s axis of rotation (now, in Jan., elliptical orbit has Earth closest to Sun when N. pole faces away therby moderating the winter somewaht, but later the elliptical orbit will have Earth furthest away in Jan. when N. pole faces away from the Sun thereby making winters even colder). 2. Milankovitch Theory.Variation in obliquity of Earth’s axis of rotation (somewhere between 22 degrees to 24.5 degrees). The less the tilt the less marked the seasons. Fig. 14-9, p.385
No atmosphere With an atmosphere containing greenhouse gases Some natural causes for climate change: 3. Natural Greenhouse Effect. Natural variation in greenhouse gases could change climate. Recall greenhouse effect from Chapter 2. Fig. 2-10, p.37
10 mm 10 mm % transmittance Light blue = transmitted Dark blue = not transmitted Earth emits most radiation at about 5 -15 mm. The most important greenhouse gas is water vapor, which absorbs strongly here, except at 10 mm. Second is carbon dioxide (CO2) Fig. 2-9f, p.36
Cloud = white aerosol Fig. 14-16, p.395
Not only gases affect radiation budget, but also aerosols – tiny particles of dust and liquid that reflect light back out to space, or absorb light (if they’re dark colored). Fig. 14-11, p.387
Aerosols have both natural and anthropogenic sources. Anthropogenic sources include combustion of sulfur-containing fossil fuel that results in sulfate aerosol formation, among other effects. Fig. 14-12, p.389
Figure 9: Global, annual-mean radiative forcings (Wm-2) due to a number of agents for the period from pre-industrial (1750) to present (late 1990s; about 2000) (numerical values are also listed in Table 6.11 of Chapter 6). From IPCC Climate Change 2001: Working Group I: The Scientific Basis
NASA’s Earth Observatory Fig. 14-17, p.396