Download
1 / 35
350 likes | 356 Vues
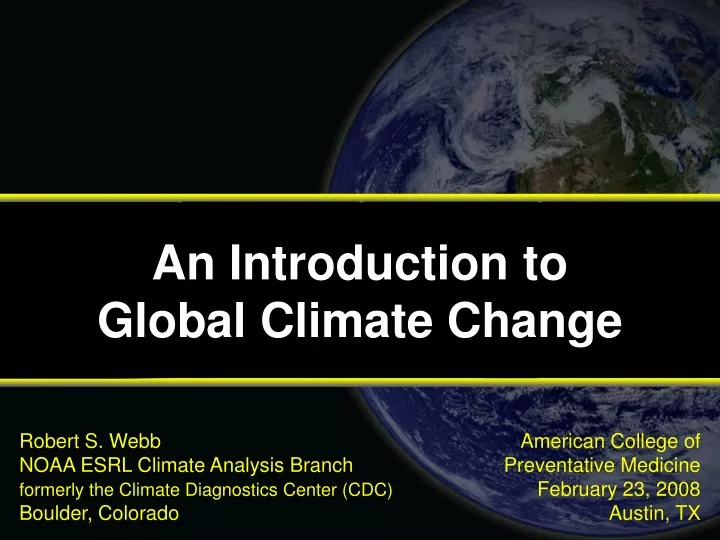
An Introduction to Global Climate Change. Robert S. Webb NOAA ESRL Climate Analysis Branch formerly the Climate Diagnostics Center (CDC) Boulder, Colorado. American College of Preventative Medicine February 23, 2008 Austin, TX. Overview. Global Climate Change: Trends & Projections

E N D
An Introduction to Global Climate Change Robert S. Webb NOAA ESRL Climate Analysis Branch formerly the Climate Diagnostics Center (CDC) Boulder, Colorado American College of Preventative Medicine February 23, 2008Austin, TX
Overview • Global Climate Change: Trends & Projections • North America: Trends & Projections • Parting Thoughts
What is Climate Climate is the aggregated pattern of weather, meaning averages, extremes, timing, spatial distribution of… • hot & cold • cloudy & clear • humid & dry • drizzles & downpours • snowfall, snowpack, & snowmelt • blizzards, tornadoes, & typhoons Climate change means altered patterns. Global average temperature is just one measure of the state of the global climate as expressed in these patterns. Small temperature changes big changes in the patterns. (after Holdren NCES, 2008)
What is an extreme event (CCSP SAP 3.3)
Global Temperatures are increasing Green bars show 95% confidence intervals the 15 hottest years all occurred since 1990 http://data.giss.nasa.gov/gistemp/graphs/
2007 Surface Temperature Warmest 9th Warmest
Historic record of global climate change Warming of the climate system is unequivocal, as is now evident from observations of increases in global average air and ocean temperatures, widespread melting of snow and ice, and rising global mean sea level.
Warm nights increasingCold nights decreasing Frequency of occurrence of cold or warm temperatures for 202 global stations for 3 time periods:1901 to 1950 (black), 1951 to 1978 (blue) and 1979 to 2003 (red).
Proportion of extreme precipitation events increasing in most areas NH Summer NH Winter The frequency of heavy precipitation events has increased over most land areas - consistent with warming and increases of atmospheric water vapor while more intense and longer droughts have been observed since the 1970s, particularly in the tropics and subtropics.
Greenhouse gas concentrations Compared to natural changes over the past 10,000 years, the spike in concentrations of CO2 & CH4 in the past 250 years is extraordinary. Humans are responsible for the recent dramatic increase emissions. Fossil CO2 & CH4 lack carbon-14, and the observed drop in atmospheric C-14 is measurable. (IPCC AR4 WG1, 2007)
Ranges of projected surface warmingmulti-model averages for different emission scenarios and assessed ranges of warming (IPCC AR4, 2007)
Projected surface temperature changes for the early and late 21st century relative to the period 1980–1999 Continents Warm 50% more than oceans
Observed & simulated continental & global scale changes in surface temperature observed change (black line); climate models simulations using natural (blue) and anthropogenic (red) forcings
Projected percent changes in precipitation for the period 2090–2099(relative to 1980–1999) NH Summer NH Winter Warmer climate More Water Vapor in the atmosphere but an expanded belt of subtropical aridity
Changes in the physical and biological systems and surface temperature 1970-2004 (IPCC WG2, 2007)
Observed trends in some biophysical and socio-economic indicators in North America (IPCC WG1, 2007)
Changes in the percent of days in a year above three thresholds for North America for daily high (top) and low (bottom) temperature CCSP SAP 3.3
U.S. national average “heat wave” indexdefined as warm spells of 4 days in duration with mean temperature exceeding the threshold for a 1 in 10 year event CCSP SAP 3.3
Area of the U.S. with much above normal daily high and low summer temperatures CCSP SAP 3.3
Regions in where heavy and very heavy precipitation has increased CCSP SAP 3.3
Observed & simulated changes in regional surface temperature IPCC WG1, 2007
Days in a year averaged over North America when daily low temperature is in the top 10% of warm nights for 1961-90 CCSP SAP 3.3
Number of frost days per year averaged over North America CCSP SAP 3.3
Growing season length averaged over North America CCSP SAP 3.3
Rainfall on days in the top 5% of heavy precipitation days for the period 1961-1990 averaged over North America CCSP SAP 3.3
Projected increase in occurrence of extremely rare hot days (a 1 in-20 year event) (from Wehner 2005)
Possible impacts of climate change due to projected changes in extreme weather and climate events(IPCC, 2007)
Emerging ChallengesPythons could squeeze lower third of USA Feb 21, 2008 By Elizabeth Weise, As climate change warms the nation, giant Burmese pythons could colonize one-third of the USA, from San Francisco across the Southwest, Texas and the South and up north along the Virginia coast, according to U.S. Geological Survey maps released Wednesday.The pythons can be 20 feet long and 250 pounds. They are highly adaptable to new environments. Current Range Projected Range ca. 2100
Valuable Resources IPCC Reportswww.ipcc.ch CCSP Reportswww.climatescience.gov
Summary of relative direction, magnitude and certainty of health impacts to changes in climate CCSP SAP 4.6
Temperature-mortality relative risk functions for 11 U.S. cities, 1973–1994 (Curriero et al. 2002)
Projected increase in occurrence of extremely high rainfall days (a 1 in-20 year event) (from Wehner 2005)
Drinking waterborne disease outbreaks and 90 percentile precipitation events (Curriero et al. 2001)