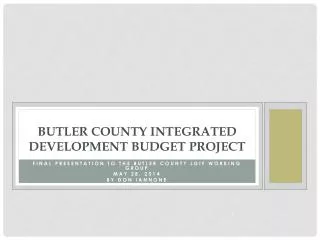
BUTLER COUNTY MIDDLE 2013-2014 DATA ANALYSIS
180 likes | 195 Vues
Explore the K-Prep scores and achievement trends at Butler County Middle School (BCMS) for the 2013-2014 academic year. Analyze the scores in math and reading for 6th through 8th grade, identify gaps, and learn about the school's plan of action to improve student performance.

BUTLER COUNTY MIDDLE 2013-2014 DATA ANALYSIS
E N D
Presentation Transcript
BUTLER COUNTY MIDDLE 2013-2014 DATA ANALYSIS EXPANDING MINDS… STRENGTHENING BODIES … NURTURING SPIRITS… FOR LIFELONG SUCCESS.
8th Grade this year 14.5 14.4 14.2 15.9 14.9
8th Grade this Year 66 29 42.5 8.0
MATH READING 2014-15 6th Through 8th Grade Scores Moving Students Achievement 6th Grade – 37/25 N/A - 13/10 A/P– 15/9 P/D– 9/6 7th Grade – 41/27 N/A – 15/7 A/P – 19/14 P/D – 7/6 8th Grade – 31/24 N/A – 11/7 A/P – 14/12 P/D – 6/5 Moving Students Achievement 6th Grade – 74/39 N/A – 34/15 A/P– 24/14 P/D– 16/10 7th Grade – 41/27 N/A – 24/8 A/P – 17/7 P/D – 5/5 8th Grade – 42/23 N/A – 12/1 A/P – 14/11 P/D – 16/11 2014-15 6th Through 8th Grade Scores if targets works Moving Students Gap 6th Grade – 50/24 N/A – 21/7 A/P– 20/10 P/D– 8/7 7th Grade – 23/11 N/A – 15/6 A/P – 10/5 P/D – 1/1 8th Grade – 27/16 N/A – 8/1 A/P – 10/9 P/D – 9/6 Moving Students Gap 6th Grade – 28/22 N/A – 10/9 A/P– 11/8 P/D– 7/5 7th Grade – 23/11 N/A – 13/6 A/P – 8/3 P/D – 2/2 8th Grade – 18/14 N/A – 10/7 A/P – 6/6 P/D – 2/1
2014-15 6th Through 8th Grade Scores READING MATH 6th Grade – 15/10 7th Grade – 20/12 8th Grade – 19/6 TOTAL – 44/28 6th Grade – 13/7 7th Grade – 21/9 8th Grade – 14/8 TOTAL – 48/24 2014-15 6th Through 8th Grade Scores if targets works
BCMS Plan of Action School Wide Initiatives Annotating KPREP/Explore like Assessments with time variations Content Vocabulary Common writing programs across the school Question stems used school wide Thinking strategies Cube
BUTLER COUNTY MIDDLE 2013-2014 DATA ANALYSIS Questions?