Download
1 / 20
200 likes | 580 Vues
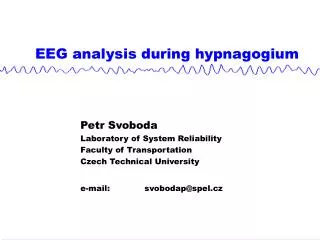
Phase Analysis of Hand Movement-Related EEG Activity. Xuan Hung Ta, Sun Young Cho, Jung Ae Kim, and Seung Kee Han*. Department of physics, Chungbuk National University. 7 sec. 5 sec. 3 sec. Control. Button Press. t (ms). Self-Paced Hand Movement. 164 trials for left-hand movement

E N D
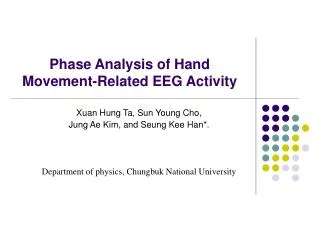
Phase Analysis of Hand Movement-Related EEG Activity Xuan Hung Ta, Sun Young Cho, Jung Ae Kim, and Seung Kee Han*. Department of physics, Chungbuk National University
7 sec 5 sec 3 sec Control Button Press t (ms) Self-Paced Hand Movement • 164 trials for left-hand movement • 195 trials for right-hand movement • Using 32-channel recording • Epoching 7 secs before and 5 secs after pressing button. • 1000 Hz sampling, SCD Filtered
Frequency properties of EEG • - three frequency components digital band-pass filter: theta (4~7Hz), alpha (8~13Hz) and beta (13~30Hz) • Alpha frequency dominant
Topography of αERD/ERS Left: Right: -5s 0s 4s Event-Related-Desynchronization and Synchronization (ERD / ERS) • Self-paced hand movements are preceded by a decrease in the power of oscillatory EEG activities in α and β rhythms over central cortical areas. • ERD is believed to indicate a state of active cortical processing. • Upward gradients denote an increase in power (ERS), while downward ones denote power decrease (ERD) compared to baseline. • Topographic patterns in α rhythms, showed contralateral dominance of ERD. Alpha Alpha Beta Beta ERD / ERS(%) = [(Psegment – Pcontrol) / Pcontrol ] x 100
Dynamics in alpha rhythms • Reflect an aroused but idling state of cerebral cortex • Show strong bursting activity. • Bursting termination events Inter-Burst Interval: Power law distribution (∝ t-6 ) Relation between bursting activity and movement? The threshold for bursting termination point: H1 = mean (amplitude) – f * std (amplitude) , f = 1
Sliding window event left right trial 1 trial 2 Terminations: trial 3 left trial N right Δt peaks: Average norm. ECR (-1s ~ 1s) Event count rate (ECR) • The useful information in timing might be carried by instantaneous Event Count Rate. • Bursting termination event rate increases around movement onset while bursting peak event rate decreases.
n Low coherency High coherency Spatial phase coherence Definition of Phase : Hilbert transform s(t) : band-pass filtered time-series data A(t) : instantaneous amplitude (t) : instantaneous phase PV[] : Cauchy principal value Spatial Phase Coherence (SPC): quantifies the coherence of the instantaneous phases of dominant frequency across channels. n(t) : the phase of nth channel at time t N : total number of channels
Spatial phase coherence Relation between phase in specific-frequency band and movement? • Self-paced finger movements are associated with the increase of spatial phase coherence in α rhythms (8 – 13Hz).
Pj(t - Δt) Pj(t) Δj Δj Low coherency High coherency Temporal phase coherence (TPC) • TPC describes the correlation between phases in specific-frequency band of channels observed at different moments in time • In right-hand movement, TPC of right semi-hemisphere showed an increase during movement onset
Conclusions and future works • The frequency-specific changes of EEG may correlate to sensory, motor and cognitive processing. • EEG signal could be applied for the communication between the brain and an electronic system like a computer – Brain Computer Interface (BCI). • The further studies are finding the features to discriminate left/right hand movement in a single trial.
ERSP (Event-Related Spectral Perturbation) • ERSP help to examine event related changes in signal energy from the broader perspective of the entire time-frequency plane • These spectral changes typically involve more than one frequency or frequency band, so full-spectrum ERSP analysis yields more information. ERSP : PERSP(t,f) = 10*log10 (P(t,f) / <Ppre(t,f)>t)
ERSP • Self-paced finger movements are associated with power suppression in α (8 – 12Hz) and β (13-25 Hz) rhythms. • Beta power rebounded above baseline following movement. It may reflect either inhibition of cortical activity or “re-establishment” of cortical circuits to prepare for future activation.
n Phase Analysis of Single-Trial EEG Definition of Phase : Hilbert transform s(t) : band-pass filtered time-series data A(t) : instantaneous amplitude (t) : instantaneous phase PV[] : Cauchy principal value Inter-Trial Coherence (ITC): quantifies the coherency of the instantaneous phases across trials. n(t) : the phase of nth trial at time t N : total number of trials Low coherency High coherency
Bursting termination Δt Bursting in alpha rhythms • near the bursting termination : instantaneous phase velocity (’) jump to unexpected value.
Power spectrum • Power spectra of C3, C4 showed decrease at both alpha and theta rhythms. • After hand movement the power recovered significantly. • The activity on C4 is stronger in both left-hand and right-hand movement. • 3sec power spectra from EEG data of C3, Cz, and C4 • pre-movement( Red line),movement (Blue),post-movement (Green)