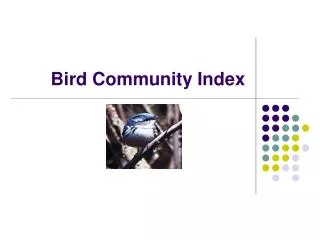
Bird Community Index
Bird Community Index. Bird community index. Relationship to keystone or umbrella species. Bird community index. Bird Community Index: Based on extensive Mid-Atlantic environmental monitoring work (EPA, Penn State) Assumes ecological condition correlates with land cover

Bird Community Index
E N D
Presentation Transcript
Bird community index Relationship to keystone or umbrella species
Bird community index • Bird Community Index: • Based on extensive Mid-Atlantic environmental monitoring work (EPA, Penn State) • Assumes ecological condition correlates with land cover • High proportion of birds with specialized requirements indicates healthy natural forest habitat • BCI Score: • Based on amount of forested land cover within 200 acre window • Accounts for edge effects from disturbed land cover • Indicates overall ecological condition as poor, average, or good/excellent
Bird community index • Birds are a good indicator of a regions overall ecological landscape condition • Sensitive to physical, chemical, biological threats • Birds are easily identified • Particularly sensitive to the availability of food, shelter, breeding • The BCI measures overall ecological condition by relating the types of birds inhabiting an area with the surrounding land cover
BCI • Inputs: land cover for a buffered study area
BCI Steps (simplified): • Buffer study area to account for overlap • Subset land cover for buffered study area • Create a forest cover map • Create a human cover map • Create a grid of human cover tracts greater than or equal to 5 acres • Expand human land cover tracts • Query forested pixels in buffer area • Create grid combining forest buffer and all other human land cover pixels
BCI – step 1 and 2 • Buffer study area by 500 meter, use the buffer to mask the extent and create a grid of land cover
BCI – step 3 Create a “Forest” cover grid • Reclassify land cover grid so all forest cover classes = 1 with open water and wetlands = nodata and everything else = 0, call this grid “forest”
BCI – step 4 Create a “human cover” grid • Reclassify land cover so that all human created classes get a value = 1 with open water and wetlands = nodata and everything else = 0, call this grid “human cover”
BCI – step 5 Create a “human cover 5 acres” grid • Next, find all human cover areas greater than or equal to 5 acres (around 23 cells for 30m grid cells), call this grid “human cover 5 acres” • This can be done with the majority filter command
BCI – step 6 • Expand the human cover 5 acres grid out approximately 3 cells with the expand command. Call this grid “expanded” NOTE: no spaces in grid name
BCI – step 7 a and b • Then reclassify the grid so 0 and nodata values are 2, and keep 1 = 1, call this grid “step7b” • Query to find the forested pixels in the expanded area
BCI – step 8 a and b • Create grid combining forest buffer and all other human cover • First reclass “human cover” grid so 1 is now 0 and nodata is now 1, and 0 is 1, call this grid “step8a” Next, find all the forested pixels in the expanded area • multiply the above grid (step8a by the step7b grid ) to get the result and call it “step8b”)
BCI – interpretation of the final result “step8b” • 0 indicates all non buffered human land cover tracts under 5 acres, • 1 indicates all forested buffers surrounding human cover tracts over 5 acres, and • 2 indicates all remaining forested areas
Bird community index • Areas with a low index contain more non forest land uses due to ag, mining, timbering, urban/residential development • These areas are fine for generalist species such as European Starlings, American Crows, Blue Jays • Areas with a high index are primarily forested and provide habitat for many neotropical migratory birds • Examples include Cerulean Warbler, Scarlet Tanager, and Louisiana Waterthrush
References Boyce, M.S., and A. Haney. 1997. Ecosystem Management: Applications for Sustainable Forest and Wildlife Resources. Yale University Press, New Haven & London. 361 pages Forman, R.T. T., and M. Godron. 1986. Landscape Ecology. Wiley, New York. Grumbine, R. E. 1994. What is Ecosystem Management. Conservation Biology8:27-38. Hobbs, R. 1997. Future Landscapes and the Future of Landscape Ecology. Landscape and Urban Planning 37:1-9. Jones, B.K, K.H. Ritters, J. D. Wickham, R.D. Tankersley, R.V. ONeill, D.J. Chaloud, E. R. Smith, and A.C. Neale. 1997 An Ecological Assessment of United States Mid-Atlantic Region: A Landscape Atlas.