Download
1 / 27
270 likes | 359 Vues
This report provides an overview of the environmental status in the Narragansett Bay Region, covering topics such as estuarine waters, fresh waters, living resources, watershed lands, and ecosystem management. Major findings include issues with pollution sources, land use impacts, and challenges in monitoring ecosystem function. Recommendations focus on improving indicators, enhancing ecosystem tracking systems, and aligning management efforts with ecosystem values for better environmental stewardship.

E N D
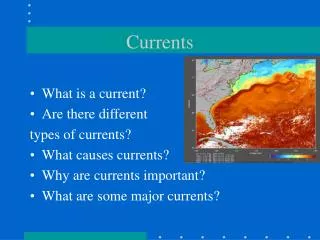
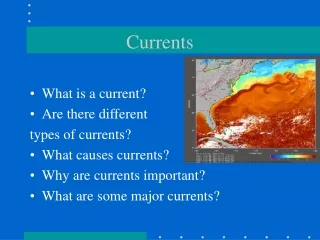
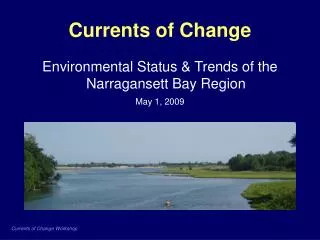
Currents of Change Environmental Status & Trends of the Narragansett Bay Region May 1, 2009
Narragansett Bay Region • Geographic scope: • N. Bay estuary, N. Bay watershed, Wood-Pawcatuck & Salt Ponds watersheds • To capture major influences on estuary: physical; biological; political • 2,066 s.m. area; 50% in Mass.; 48% R.I.; 2% CT • Bay area: 192 s.m. with 95% in R.I. • Population: 2 million in 102 municipalities
Major Sections • Estuarine waters • Fresh waters • Living resources • Watershed lands • Ecosystem management
General Findings • Control of point sources improving for currently regulated pollutants • Control of non-point sources ineffective • Land use impacts significant • Observed changes in temperature and flow are likely linked to climate change • Environmental information is of variable quality and coverage, and often inconsistent across state lines • Trends are difficult to discern for many reasons • Environmental monitoring and management approaches often do not measure ecosystem function and structure
Estuarine Indicators • Hypoxia • Chlorophyll • Beach Closures • Shellfish Restrictions • Toxics in fish tissue (sidebar)
Estuarine Conclusions • Hypoxia: Serious problem degrades habitat in upper NB; driven by nutrients, correlated with June river flows • Beach closures correlated with local stormwater • Shellfish restrictions also correlated with stormwater • Observed shifts in chlorophyll concentrations • Fish tissue: Mercury & PCBs high but consistent with MA & CT
Fresh Waters Indicators • Bacterial impairments • Dissolved oxygen impairments • Nutrient impairments • Chloride • Low flow
Fresh Water Conclusions • Bacterial problems in half of NBR’s rivers; limited problem in lakes • DO and nutrients are localized problems in rivers and lakes • Chloride is increasing, but below standards • Low riverine flow is an emerging issue of real concern throughout NBR
Hunt River at Forge Rd., N. Kingstown, RI July 7, 2007
Living Resources Indicators • Estuarine fish • Wetlands • Invasive species • Seagrass
Living Resources Conclusions • Resident demersal fish declining, possibly due to fishing & climate change • Wetlands acreage declining at low rate; function/quality is largely unassessed • Invasive species are widespread in the NBR • Seagrass has declined historically; now stable, possibly beginning recovery
Watershed Lands Indicators • Land Use/Land Cover • Impervious Surface
Watershed Lands Conclusions • Conversion of land increasing: 24% of NBR is developed (1/3 of uplands) • Sprawl increasing; 14% of NBR covered by impervious surface • Coastal areas have seen significant growth as population shifted from urban areas • Land use driving water quality and other ecosystem impacts • Better interstate information and analysis are needed
Ecosystem Management Indicators • Water Quality Management Actions • Environmental Expenditures • Environmental Reporting
Ecosystem Management Conclusions • Significant investments in point source control (WWTFs, CSO, etc.) • Investments in land protection increasing • Agency staff stable or declining • Federal contribution to state programs increasing • Reporting insufficient to fully measure environmental outcomes
Needs Identified • Improve indicators/fill information gaps • Better align indicators with ecosystem values • Develop effective system for tracking and reporting ecosystem condition based on interstate and organizational collaboration Objectives: • to better assess environmental progress • To improve effectiveness of management and stewardship efforts.
“Despite growing environmental challenges facing the United States, the current system of collection and delivery of information about environmental trends is unable to meet current and future needs of decision makers.” From “State of the Nation’s Ecosystems 2008” - the Heinz Center for Science, Economics and the Environment
Status & Trends Report and Workshop Results at www.nbep.org Labor In Vain Brook, Somerset MA