Pick up a warm up from the front!
50 likes | 177 Vues
In this Math III warm-up from April 18, 2013, students will analyze the heights of the twenty highest dams, ranging from 225 to 335 meters. The task involves selecting appropriate class intervals, defining class limits, identifying class marks, and constructing a frequency distribution table. Additionally, students will be instructed to create a histogram to visually represent the data. Essential vocabulary for an upcoming quiz will also be reviewed, which includes terms like simple random sample and explanatory variable.

Pick up a warm up from the front!
E N D
Presentation Transcript
Pick up a warm up from the front! April 18th, 2013
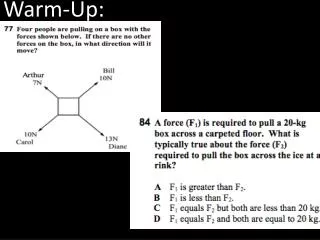
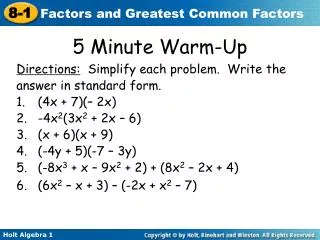
Math III Warm Up 4/18/13 The twenty highest dams have heights of 240, 335, 260, 300, 285, 262, 272, 225, 242, 261, 233, 250, 243, 237, 236, 243, 234, 235, 226, and 261 meters. 1. Find an appropriate class interval. 2. Name the class limits. 3. Find the class marks. 4. Construct a frequency distribution table. 5. Draw a histogram of the data.
Words you need to know for quiz: • Simple random Sample • Stratified random Sample • Cluster Sample • Systematic Sample • Response Variable • Explanatory Variable • Experimental Study • Treatment • Confounding Variable • Observational Study And: Be able to create a Frequency Distribution and Histogram
Class Assignment: Complete the back of the Homework Assignment14-1 Practice