Download
1 / 14
140 likes | 254 Vues
This educational resource delves into key concepts of pie charts, including construction and interpretation. Students will learn how to analyze survey results and represent data visually. The guide also covers practical math skills, such as calculating change after purchases and understanding symmetry. Engaging activities challenge learners to apply their knowledge to real-life scenarios and encourage students to create their own pie charts based on class surveys. This comprehensive approach supports both mathematical comprehension and practical application.

E N D
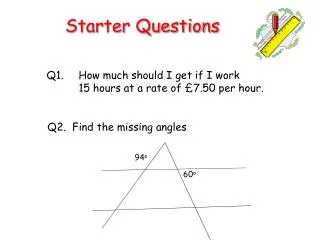
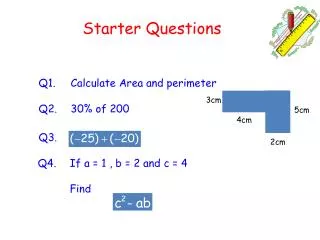
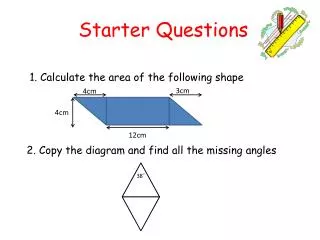
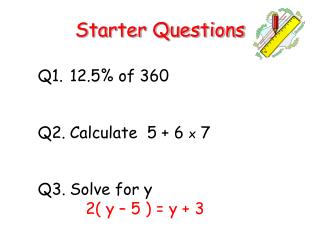
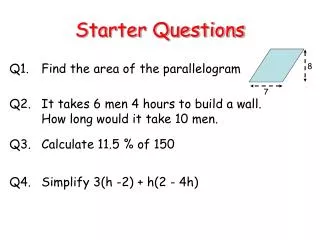
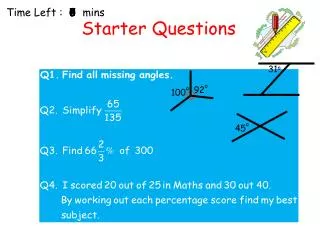
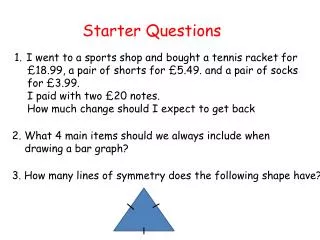
Starter Questions I went to a sports shop and bought a tennis racket for £18.99, a pair of shorts for £5.49. and a pair of socks for £3.99. I paid with two £20 notes. How much change should I expect to get back 2. What 4 main items should we always include when drawing a bar graph? 3. How many lines of symmetry does the following shape have?
Pie Charts Learning Intention • To explain the main points of a Pie Chart and how to construct them.
Pie Charts Come up with a question that we can answer using this Pie Chart. Created by Mr.Lafferty Maths Dept
Pie Charts Come up with a question that we can answer using this Pie Chart. Created by Mr.Lafferty Maths Dept
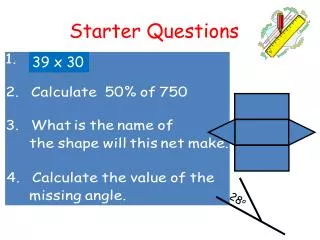
Pie Charts Pie charts can be thought of as circle graphs. 360o How many degree in a circle 90 How many degrees in one slice 90o What fraction is each slice of the circle
Pie Charts Pie charts can be thought of as circle graphs. 360o How many degree in a circle 120 How many degrees in one slice 120o What fraction is each slice of the circle
Pie Charts Work out the fraction and degrees for each slice of the circles.
Pie Charts Let’s make up our own question
Chinese Indian Italian French Pie Charts The pie chart shows the results of a class survey into favourite restaurant food. Write down the fraction of the class that choose Indian Chinese Italian French
Pie Charts 50 people were asked what was there favourite holiday Spain How many chose America
Pie Charts Count the number of parts the circle is divided into. Whole circle is divide into 20 equal pieces 1 piece is equal to The whole circle represents 100 bottles. How many bottles does 1 piece represent. 5
Pie Charts What does each part stand for ? What fraction represents each mealtime ? There is 100 pupils in the survey? What is 1/20 of 100. How many people chose each mealtime? Created by Mr.Lafferty Maths Dept
Easy Pie Charts 10 30 20 10 20 10 15 15 30 5 15 15 5
Pie Chart For this question construct a Pie Chart using the Pie Chart worksheet.