Understanding and Creating Pie Charts in Mathematics
This educational resource aims to teach students about pie charts, including how to calculate angles, fractions, and areas related to circular graphs. Through a series of questions and examples, learners will explore the components of pie charts, how to interpret data visually, and how to construct their own charts based on survey results. With practical exercises involving favorite foods and holidays, this guide aims to enhance math skills and promote data literacy.

Understanding and Creating Pie Charts in Mathematics
E N D
Presentation Transcript
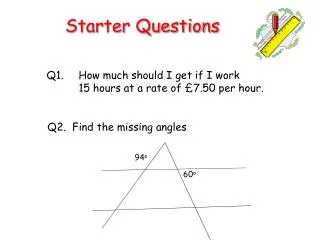
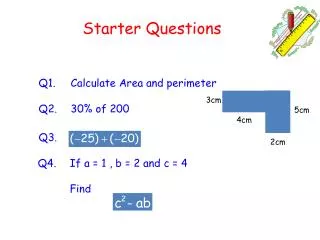
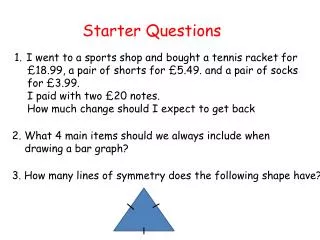
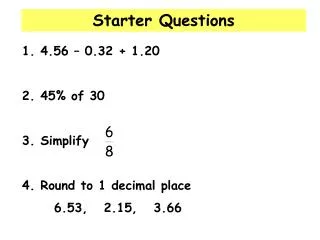
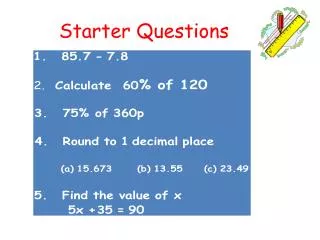
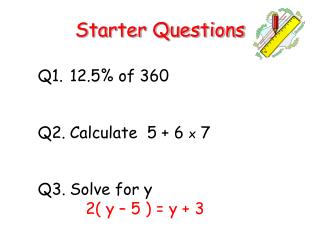
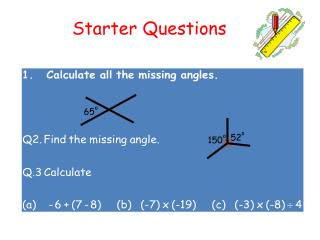
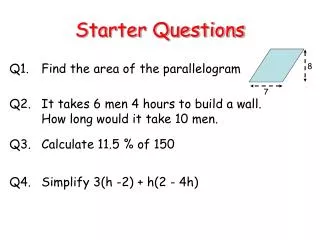
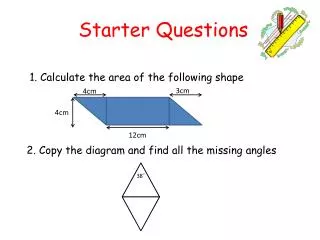
Starter Questions 1. Calculate the area of the following shape 3cm 4cm 4cm 12cm 2. Copy the diagram and find all the missing angles 38˚
Pie Charts Learning Intention • To explain the main points of a Pie Chart and how to construct them.
Pie Charts Come up with a question that we can answer using this Pie Chart. Created by Mr.Lafferty Maths Dept
Pie Charts Come up with a question that we can answer using this Pie Chart. Created by Mr.Lafferty Maths Dept
Pie Charts Pie charts can be thought of as circle graphs. 360o How many degree in a circle 90 How many degrees in one slice 90o What fraction is each slice of the circle
Pie Charts Pie charts can be thought of as circle graphs. 360o How many degree in a circle 120 How many degrees in one slice 120o What fraction is each slice of the circle
Pie Charts Work out the fraction and degrees for each slice of the circles.
Pie Charts Let’s make up our own question
Chinese Indian Italian French Pie Charts The pie chart shows the results of a class survey into favourite restaurant food. Write down the fraction of the class that choose Indian Chinese Italian French
Pie Charts 50 people were asked what was there favourite holiday Spain How many chose America
Pie Charts Count the number of parts the circle is divided into. Whole circle is divide into 20 equal pieces 1 piece is equal to The whole circle represents 100 bottles. How many bottles does 1 piece represent. 5
Pie Charts What does each part stand for ? What fraction represents each mealtime ? There is 100 pupils in the survey? What is 1/20 of 100. How many people chose each mealtime? Created by Mr.Lafferty Maths Dept
Easy Pie Charts 10 30 20 10 20 10 15 15 30 5 15 15 5
Pie Chart For this question construct a Pie Chart using the Pie Chart worksheet.