Analyzing WACC: Key Insights on Technip’s Capital Structure and Strategic Growth
This document delves into Technip’s Weighted Average Cost of Capital (WACC), focusing on its substantial reliance on the oil and gas sector and major acquisitions. Headquartered in Paris, France, Technip generates €8.2 billion in revenue and employs 38,000 staff across 48 countries. The analysis of cost of equity and debt, utilizing methods like CAPM and financial disclosures, reveals opportunities for growth in high-demand markets like Asia and the Middle East. Understanding these factors is crucial for maintaining a robust order backlog and continued innovation.

Analyzing WACC: Key Insights on Technip’s Capital Structure and Strategic Growth
E N D
Presentation Transcript
Module 6-WACC Drew Williams
Basic Facts • Energy technology, project management, and maintenance (97% from oil and gas) • Headquarted in Paris, France • Revenue = 8.2 Billion Euros • 11.5 Billion in Assets • Employ 38,000 people in 48 countries • 2 Major Segments • Onshore/Offshore • Subsea—niche area
Financial Goals and Operating Priorities 6-8% margins on Onshore/Offshore projects ~15% margins on all subsea projects Continue to be the leader in tough climate and subsea contacts Keep a consist and robust order backlog Continue to innovate through extensive investment in R&D Focus on high growth areas i.e. Asia, Middle East, Brazil
Disclosures Did you hear about the cartoonist who was found dead in his home? The details are sketchy
Major Acquisitions • Global Industries Ltd. • December 2011 • 100% Ownership • Sub-Sea know-how • Further entry into US and Mexican waters • $1.262 Billion Purchase • Issues • Did not produce 2011 Financials • Solution: Use 2010 financials + Extrapolate 2011 Quarterly Income Numbers
Major Acquisitions • Stone & Webster Process Technologies • Purchase segment from The Shaw Group • Refining and Petroleum Chemicals—diversify • Further enter US Market • $295.3 Million Purchase • Isssues • No Financials for this Segment within Shaw • Purchased a segment of a segment • Different Fiscal Year (August 31 Year End) • The Shaw Group purchased in Feb 2013 • Solution: Input=0, cite as flaw in calculation, rely on group members more heavily
Determining Cost of Capital • Step 1: Determine Cost of Equity • Using CAPM • Step 2: Determine Cost of Debt • Using Financial Expense and NFL • Using F/S Disclosures • Step 3: Find Enterprise Cost of Capital from Cost of Debt and Cost of Equity • Weighted average
Cost of Equity-CAPM • Use inputs of Beta, risk-free rate, and Market return • Beta must be calculated using historic returns • Risk Free rate must be observed using available resources • Return on the market must be estimated • Only Beta is Firm Specific
Estimating CAPM Inputs- Beta *Note: Did not subtract r(rf)—Bloomberg Method—small error possible • Beta- Stock’s Covariance with Market Returns • Method for obtaining Beta of Technip • Obtain Weekly Returns (yahoo finance) between 1/1/09 to 1/4/14 for TKPPY Adj. Price • Obtain Weekly Returns (yahoo finance) between 1/1/09 to 1/4/14 for S&P 500 • Run Regression with S&P 500 as independent variable and TKPPY as dependent • Beta = Coefficient of Correlation
Snapshot of Data Pun: I stayed up all night to ponder where the sun went…then it dawned on me
Problem with Results • Adj closing price jumps—no good explanation • No Big announcement on this day • Same Company’s stock trading in France featured no volatility • Trades as an American Depository Receipt (ADR) • Bank buys French Stock, sells it in multiples within US in USD • Seems to be an error
“Solution” to Issue Run Regression on Adj. Closing Price returns from 3/22/11 Run Additional Regression on Closing Price from 1/1/09 Run Regression on Technip stock traded on French Exchange
Regression Results-TKPPY ADJ Close from 3/22/11 • Key Stats: • Beta • R squared • Confidence Interval
Regression on TKPPY Closing Price from 1/1/09 • Key Stats: • Beta • R squared • Confidence Interval
Regression on TEC.PA from 1/1/09 to 1/4/14 • Key Stats: • Beta • R squared • Confidence Interval
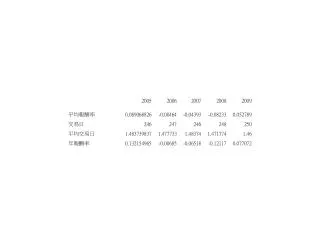
Beta from Outside Sources • Observations • Ranges from 1.347 to 1.9 • 3 Sources did not have a Beta value for Technip • Huddles toward 1.5 or 1.9
Picking a Beta • Take Average of External Betas = 1.69 • Take Average of Internal Betas = 1.55 • Average 2 Values to get Beta = 1.62 • Rough Estimate • Many Beta numbers are justifiable • Find out what is driving split between ~1.5 estimates vs. ~1.9 estimates
Estimating Risk Free Rate • Yahoo Finance • r(rf) = 3.687% • Use as proxy of the risk free rate
Estimating Market Premium I would say 4% seems about right My decision: 4% Lloyd Blankfein—Goldman Sachs CEO
Final Cost of Equity r(rf) = 3.6870% Beta = 1.62 r(mkt)-r(rf) = 4% r(Eq) = 10.17%
Cost of Debt • Use of 2 Methods • Formulaic: (Interest Expense/Average amount of Interest Bearing Debt) * (1-T) • Financial Expense/NFL • Using F/S Disclosure • Average L-T borrowing Rate * (1-T)
Cost of Debt-Formula • Seems counterintuitive • Result of a negative NFL (NFA) • Observe other method
Cost of Debt F/S Disclosure • Borrowing Rate = 3.93% • Tax Rate = 33.33% (French Statutory) • r(debt) = 2.62% • Seems more intuitive • Does not take into account reformation
Cost of Capital for the Enterprise-Value of the Enterprise • Enterprise Value = market cap + NFL • NFL = €(251.32) • Exchange Rate = 1.36 • NFL = $(341.80) • Market Cap = $9,668.73 • 439.288 = # of shares • $22.01 = Share Price • Enterprise Value = $9,326.93
Cost of Capital for the Enterprise-Weighted Average With Formula Cost of Debt With F/S Disclosure Cost of Debt r(debt) = 2.62% V(debt) = $(341.80) V(Enterprise) = $9,326.93 r(equity) = 10.17% V(Equity) = $9,668.73 WACC = 10.44% • r(debt) = -28.5% • V(debt) = $(341.80) • V(Enterprise) = $9,326.93 • r(equity) = 10.17% • V(Equity) = $9,668.73 • WACC = 11.59%
Questions It’s impossible to explain puns to kleptomaniacs. They take everything…literally