Download
1 / 20
200 likes | 472 Vues
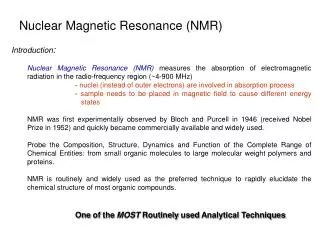
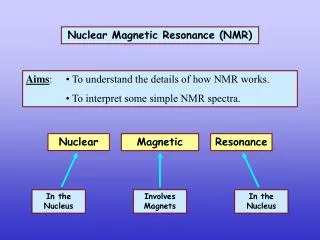
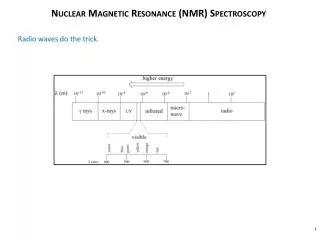
Nuclear Magnetic Resonance (NMR) Spectroscopy. Radio waves do the trick. B o. With external magnetic field Spins aligned. No external magnetic field Spin alignment random. Nuclei can be thought of as tiny magnets. D E. energy. D E. D E. energy. Magnetic field strength.

E N D
Nuclear Magnetic Resonance (NMR) Spectroscopy Radio waves do the trick.
Bo With external magnetic field Spins aligned No external magnetic field Spin alignment random Nuclei can be thought of as tiny magnets.
DE energy DE DE energy Magnetic field strength When a nucleus occupying the α spin state is subjected to radio waves, an absorption can take place. β spin state magnetic field is applied α spin state
1H NMR Spectrum An NMR spectrum is a plot of resonance frequency vs. the intensity of rf absorption by the sample.
Number of Signals homotopic enantiotopic diastereotopic
Exercise 1: Identify the number of signals expected in the 1H NMR spectrum of the following compounds. 1 signal 4 signals 4 signals 1 signal 5 signals 2 signals 2 signals 3 signals
Exercise 2: Determine whether the two protons shown in red are homotopic, enantiotopic, or diastereotopic. diastereotopic diastereotopic enantiotopic homotopic homotopic enantiotopic
Position of Signals The x-axis is a frequency scale but is normalized to be independent of the field strength. spectrometer operating at 300 MHz spectrometer operating at 60 MHz 2181 Hz larger than that of TMS 436 Hz larger than that of TMS
deshielded shielded
The different degree of shielding experienced by the protons is due to electron density.
The Shoolery’sadditivity rules: 0.6 + 2.5 + 0.3 = 3.4 exp = 3.505 ppm
Spin-Spin Splitting (Coupling) If n is the number of neighboring protons, then the multiplicity will be n + 1.
When signal splitting occurs, the distance between the individual peaks of a signal is called the coupling constant, or J value. It is measured in hertz and is independent of field strength.