Download
1 / 1
10 likes | 137 Vues
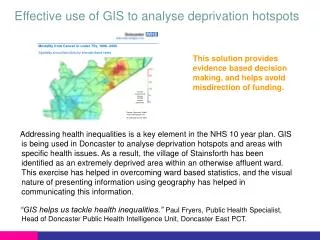
Effective use of GIS to analyse deprivation hotspots. This solution provides evidence based decision making, and helps avoid misdirection of funding.

E N D
Effective use of GIS to analyse deprivation hotspots This solution provides evidence based decision making, and helps avoid misdirection of funding. Addressing health inequalities is a key element in the NHS 10 year plan. GIS is being used in Doncaster to analyse deprivation hotspots and areas with specific health issues. As a result, the village of Stainsforth has been identified as an extremely deprived area within an otherwise affluent ward. This exercise has helped in overcoming ward based statistics, and the visual nature of presenting information using geography has helped in communicating this information. “GIS helps us tackle health inequalities.”Paul Fryers, Public Health Specialist, Head of Doncaster Public Health Intelligence Unit, Doncaster East PCT.