Analyzing Spectral Properties of Planetary Nebulae Candidates Using Starry Night Data
This study explores the methodology for identifying and analyzing planetary nebula candidates, utilizing spectral data from the Williams Gallery. Key candidates were chosen based on specific criteria, including NGC 7662 and IC 1747. Spectra were analyzed to identify emission lines and calculate their ionization potentials. Distances and sizes were determined, leading to the calculation of density and volume. Significant correlations between ionization potential, mass, and average density were found, revealing insights into the relationships among these properties in planetary nebulae.

Analyzing Spectral Properties of Planetary Nebulae Candidates Using Starry Night Data
E N D
Presentation Transcript
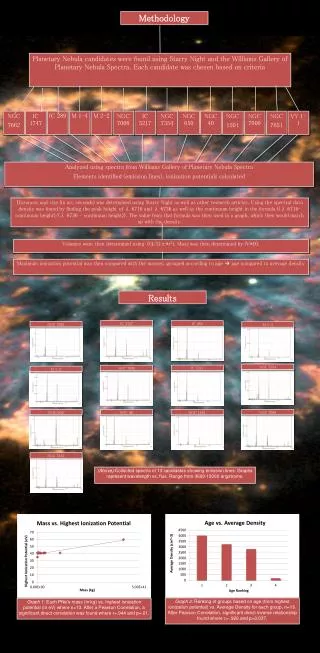
Methodology Planetary Nebula candidates were found using Starry Night and the Williams Gallery of Planetary Nebula Spectra. Each candidate was chosen based on criteria NGC 7662 IC 1747 IC 289 M 1-4 M 2-2 NGC 7008 IC 5217 NGC 7354 NGC 650 NGC 40 NGC 1501 NGC 7009 NGC 7651 VY 1-1 • Analyzed using spectra from Williams Gallery of Planetary Nebula Spectra • Elements identified (emission lines), ionization potentials calculated Distances and size (in arc seconds) was determined using Starry Night as well as other research articles. Using the spectral data density was found by finding the peak height of λ 6716 and λ 6736 as well as the continuum height in the formula ((λ 6716-continuum height)/(λ 6736 – continuum height)). The value from that formula was then used in a graph, which then would match up with the density. Volumes were then determined using ((4/3)π*r3). Mass was then determined by (V*D). Maximum ionization potential was then compared with the masses, grouped according to age age compared to average density Results IC 1747 IC 289 NGC 7662 M 1-4 NGC 7354 IC 5217 NGC 7008 M 2-2 NGC 650 NGC 40 NGC 1501 NGC 7009 NGC 7651 (Above) Collected spectra of 13 candidates showing emission lines. Graphs represent wavelength vs. flux. Range from 3600-10000 angstroms. Graph 2: Ranking of groups based on age (from highest ionization potential) vs. Average Density for each group, n=13. After Pearson Correlation, significant direct inverse relationship found where r=-.926 and p=0.037. Graph 1:Each PNe’s mass (in kg) vs. highest ionization potential (in eV) where n=13. After a Pearson Correlation, a significant direct correlation was found where r=.944 and p=.01.