Speaker
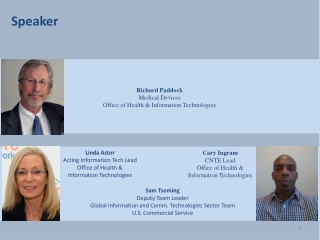
Speaker. Cary Ingram CNTE Lead Office of Health & Information Technologies. Richard Paddock Medical Devices Office of Health & Information Technologies. Linda Astor Acting Information Tech Lead Office of Health & Information Technologies. Sam Tsoming Deputy Team Leader

Speaker
E N D
Presentation Transcript
Speaker Cary Ingram CNTE Lead Office of Health & Information Technologies Richard Paddock Medical Devices Office of Health & Information Technologies Linda Astor Acting Information Tech Lead Office of Health & Information Technologies Sam Tsoming Deputy Team Leader Global Information and Comm. Technologies Sector Team U.S. Commercial Service
Industry and Analysis’Spotlight on Medical Devices March 18, 2014 March 18, 2014 Prepared by Office of Health and Information Technologies
Medical Devices Section 201(h) of the Food, Drug and Cosmetic Act defines a medical device as any healthcare product that does not achieve its principal intended purposes by chemical action or by being metabolized. • As simple as a tongue depressor or a thermometer • As complex as robotic surgery devices
Medical Device Classification • 500,000 medical technologies registered with the Global Medical Devices Nomenclature (GMDN) Agency(Source: Medtech Europe) • USFDA: Medical devices are classified by finding the matching description of the device in Title 21 of the Code of Federal Regulations (CFR), Parts 862-892. The CFR gives a general description including the intended use, the class to which the device belongs (i.e., Class I, II, or III), and information about marketing requirements. 862= Chemistry/Toxicology 878= General Plastic Surgery 864 = Hematology/Pathology 880= General Hospital 866 = Immunology/Microbiology 882= Neurological 868 = Anesthesiology 884= Obstetrical/Gynecological 870 = Cardiovascular 886= Ophthalmic 872 = Dental 888= Orthopedic 874 = Ear, Nose and Throat 890= Physical Medicine 876 = Gastro/Urology 892 = Radiology
Risk Classification Western Europe Regulatory Process TimelineSource: http://www.emergogroup.com/Source: http://medtecheurope.org/newsletternews/473/86#
Top Twenty Medical Device Companies Worldwide(Source: Medical Device and Diagnostic Industry Report as of October 2013)*ProposedRankIn 2018: http://www.mddionline.com/article/top-20-medtech-companies-2018#node-10566
Healthcare in Transition • “Governments, providers, [payers] and consumers in 2014 [face issues associated with] aging populations; increases in chronic disease; cost and quality; access to care; and technology. Deloitte, 2014 Global Healthcare Outlook • “The [healthcare] situation is particularly acute in the United States, where…we have access to quality care but face steeply rising costs. A significant cause of the cost escalation in the U.S. is the way we have historically financed and incentivized health care delivery.” Omar Ishrak, Chairman and CEO, Medtronic, Inc. • “The medical technology sector is weathering a perfect storm caused by three concurrent trends: the move toward value-based health care, growing regulatory pressures, and resource constraints within the industry itself. [To solve current] challenges in a highly regulated industry with numerous parties and conflicting interests…companies must find new ways to create, deliver and capture value. Ernst & Young, Pulse of the Industry 2013 • Every [med tech] company is faced with a choice: stick to the status quo, or transform and lead.” Michel Orsinger, Worldwide Chairman, DePuySynthes.
Trends in Healthcare Impacting Med TechResource constraints • Global Macro economic developments and the end of “easy money”. • Public and private funding systems are economically stressed by inceasing demand. • Venture capital: VC’s have moved away from early stage investment – only about 25% of med tech venture investment went to first or second rounds in 2012-13. • The total value of IPOs declined from the previous year. • Corporate capital is filling the gap. Debt continues to constitute the vast majority of the industry’s total funding in recent years, driven largely by a handful of commercial leaders who have taken advantage of historically low interest rates. • Industry Consolidation/(M&A). The case for an M&A exit has become more compelling for smaller companies.
Trends in Healthcare Impacting Med TechValue-based Healthcare 1. Volume to Value: Medical devices will need to demonstrate improved health outcomes in cost-efficient ways. • “The shift from fee-for-service to fee-for value is upon us.” Omar Ishrak, Chairman and CEO, Medtronic, Inc. • “In as few as three to five years half of healthcare payments will be based on value. At present, only 20% are”. Shahid Shah, CEO Netspective. 2. “Big Data”, Health IT and Interoperability: Medical devices will need to produce and share data to prove their value and enables predictive analytics. 3. This is leading to changing approaches for: • Governments: Increase access to care; focus on disease education and prevention. • Providers: Contend with growing consumer power, managing expectations. Seek new device technologies that streamline/complement data collection efforts and help automate manually performed tasks. • Med Tech Companies: Need to consider the whole product environment and look forexisting consumer technologies that can drive device functionality. • Payers: Bundled payments, coverage limitations, imposing penalties.
Trends in Healthcare Impacting Med TechRegulatory Pressures • Changing regulatory landscapes – increasing complexity increased levels of scrutiny. Changes are underway to existing regulatory regimes (U.S. and EU) and increasing regulatory requirements in developing countries (China, India, Brazil). • New reporting requirements: e.g. the Sunshine Act requires companies to report transfers of value to medical practitioners. • Regulations and the Environment: e.g. RoHS and REACH. • Regulatory pressures and Cost Containment:To cope with cost containment pressures, device makers are outsourcing more and more of their critical operations and materials, trying to wring out costs and improve their profitability. The unintended consequence? A much, much greater risk of supplier control violations. • Regulatory vs Reimbursement Reviews: The FDA and the CMS have extended for two years a pilot project that lets some medical devices undergo simultaneous review by the agencies. The program is meant to streamline the agencies' review processes, shrink the interval between FDA approval and determination of Medicare coverage and foster innovation.
A few words on domestic issues… • Affordable Care Act (ACA) • Medical device excise tax • Unique Device Identification (UDI) (2014) • Physician Payment Sunshine Act- tracking of payments and other “transfers of value” (2014) • Upcoming legislation on FDA budget and sustainable growth rate formula. • USFDA - Requires electronic submission of adverse event reports by August 2015
Key Characteristics of the Medical Device Sector • Recognized for its growth potential and relationship with economic development. Certain market drivers are inevitable. • Industry Structure Predominantly SMEs, however large companies have a significant share of the industry’s total revenue. • Highly Regulated: Regulatory landscapes are changing, with increased levels of scrutiny. • Reimbursement is Key: Adequate reimbursement is necessary for products to succeed in the market. • Rapid Pace of Advancement/Relatively Short Life Cycle: Average life cycle of about 18 months before an improved product becomes available. • Ebb and Flow to Market Demand: Intense competition demands faster times-to-market. Products can be overtaken by new products, or by events.
Major Issues and Strategic Objectives in Medical Devices Trade Issues • Medical devices vs. Pharmaceuticals • Medical Device Regulation Transparency • Medical Device Registration/Re-registration • Product Classification • Product Testing and Use of Standards • Quality systems vs. type testing • Acceptance of test data • Combination Products & IVDs • Clinical Trials • Tendering Procedures • Pricing • Unique Device Identifier (UDI) • Policies and Practices to Protect Data Strategic Priorities • Improve Market Access • Promote transparency and fairness and regulatory structures based on international best practices • Provide a reasonable comment, consulation with industry and transition periods on new regulations • Ensure requirements are written and enforced evenly for domestic and imported products • Ensure consideration of/access to advanced technologies • Contend with issues arising from pressures on the healthcare sector (e.g. cost containment) • Access to capital
Emergo Poll: What are the biggest challenges you face? (Sorted by respondent location )(Source: Emergo 2013)
U.S. Med Tech at a Glance Public Company Data(Source: Medical Technology Report 2013 Ernst & Young and TPIS*)
Global Demand for Healthcare/Medical Devices The United States, Japan, Germany, France, and Italy account for 13.1% of the global population and 76% of global medical device use. Conversely, the five most populous countries (China, India, Indonesia, Brazil and Pakistan) account for nearly half of the global population but only about 5-6% of global medical device use. Huge populations around the world at all income levels –[more than 1 billion worldwide] -, lack access to basic standards of health care. “The emerging markets’ share of global demand is steadily climbing, from roughly 40 percent in 2008 to an expected 66 percent by 2025 …” Ernst & Young’s Pulse of the Industry 2013/Deloitte Global Healthcare Outlook 2014
World Market Growth for Med DevicesSource: BMI Espicom Worldwide Medical Market Forecasts to 2018 ($Billion)
Global MarketTotal Market Size $284.47 (2012)(Source: Espicom)
Global Markets by RegionSource: BMI Espicom Worldwide Medical Market Forecasts to 2018 ($Billion)
China US and European med tech companies view China as a major source of growth. • Spendingon healthcare more than doubled from 2008-2012 reaching $436 billion in 2012 (Sources: GBI, RnR Market Research). Expected to near $890 billion – 5.9% of GDP - in 2017. (Deloitte) • Demand has increased dramatically, and is forecast to achieve a compound annual growth rate (CAGR) of 11% through 2018 (Sources: USITC and Global Business Intel). • China’s medical device market was valued at $20 billion in 2012 and will exceed $50 billion by 2020 (Source: Global Business Intel). • All the market drivers are there: aging population, increased urbanization, healthcare awareness, emergence of life style-related illness. By 2050 nearly one third of China’s population will be over 60. Annual orthopedic procedures are forecast to increase by 18% through 2015. China has 92 million diabetics.
India • Spending on healthcare is estimated to be 5% of GDP in 2013. and double from 2012-17, an average annual growth rate of 15.8% (Deloitte). • Promising but difficult market with a myriad of issues including regulatory uncertainties, pricing and payments, clinical trials, “systems organization”, need for targeted expansion of healthcare. • India’s approach to healthcare development is an interesting one. On the one hand it has among the lowest public health expenditures per capita in the world and a compelling need for development. On the other, its private sector and research base includes some of the world’s leaders. • There is still a compelling need for a more robust regulatory regime.
Brazil • Healthcare spending has increased in recent years to 8.9% of GDP. Forecast to exceed $250 billion by 2017. • Largest medical device market in South America. Annual rate of growth 15–19 % from 2008-11. Valued at about $7.9 billion in 2012, expected to exceed $13 billion by 2020. Double digits growth should resume in 2014 and continue through 2015. (Source: Medistat) • Medical products in Brazil are highly regulated by ANVISA, the Brazilian counterpart of FDA. • Webinar: Selling Medical Equipment in Brazil will take place on March 19, 2014, from 1pm to 2:15pm https://emenuapps.ita.doc.gov/ePublic/event/editWebReg.do?SmartCode=4Q4T.
Western Europe • The European Union remains the top export market for U.S. medical device suppliers and has been for decades. The EU represents roughly a third of the world’s market, surpassed only by the United States for production and consumption of med devices. • Three EU Member States -- France, Germany, and the United Kingdom – are NEI priority markets for the medical technology sector. U.S. exports to the top twelve countries in the EU that represent the bulk of the market approached $8 billion in 2012. • “Greater regulatory compatibility can be achieved through a range of regulatory cooperation tools as well as other steps aimed at eliminating unnecessary regulatory differences.”
Other Key Markets(Source: Medistat Forecast to 2016) • Japan • 33.3 $B (2012) / 33.5 $B (2016) • Percent imported: 35.1% • South Korea • 5.4 $B (2012) / 7.86 $B (2016) • Percent imported: 57.9% • Mexico • 3.7 $B (2012) / 4.3 $B (2016) • Percent imported: 95%
ASEAN Economies • Singapore, Malaysia, Philippines, Indonesia, Thailand, Viet Nam, Brunei, Cambodia, Laos and Myanmar. • Combined population of 600 million; combined GDP exceeding $2.5 Trillion. Combined med device market of about $6 Billion. • In 2012, the MDPWG supported a Commerce and USAID proposal for a multi-year series of training programs, consisting of both ASEAN-wide and country-specific workshops focused on MD regulatory harmonization. The workshops emphasized a globally harmonized approach to medical device regulation based upon GHTF guidance documents.
U.S. Industry Outlook for Med Tech • “2014 is not looking like a banner year for the medical device market – but it won’t be a loser, either. We believe the outlook for 2014 is not much improved over 2013 – we expect low, single-digit growth overall. Global companies have balanced out weak demand in developed markets for mature products with double-digit growth in emerging markets, and new product introductions that address new patient populations…”Cheryl Richer, Director, Corporate Healthcare for Standard & Poor’s. • Market performance will vary across product segments. certain segments remain weak while certain non-communicable disease segments - atrial fibrillation and neuro-modulation - are exhibiting stronger growth. Kaloramaforecasts respiratory devices market will grow 4.6% annually through 2017 • While demand is slowing in the U.S. and in Europe it’s growing in Asia. Firms based in the Asia-Pacific region expressed the most optimism for the 2014 business climate. • General sustained optimism past 2014: Positive expectations for the industry as a whole have increased slightly from January 2013. Nearly 75% of respondents reported "somewhat positive" or "very positive" outlooks for 2014 compared to 71% in our 2013 survey. • http://www.healthcarefinancenews.com/news/2014-medical-device-market-lukewarm • http://www.emergogroup.com/research/download-annual-medical-device-industry-survey
THANK YOU! CONTACT INFORMATION Office of Health and Information Technologies (OHIT)International Trade Administration
Industry and Analysis’Spotlight on Communications Network& Transmission Equipment March 27, 2014 Prepared by Office of Health & Information Technologies
What is Communications Network and Transmission Equipment (CNTE)? Communications Network and Transmission Equipment includes: • Telephone Apparatus Manufacturing (NAICS 334210) • Radio and Television Broadcasting and Wireless Communications Equipment Manufacturing (NAICS 334220) • Fiber Optics Cable Manufacturing (NAICS 335921*) • Copper Rolling, Drawing, Extruding, and Alloying (NAICS 331420*) • Other Communication and Energy Wire Manufacturing (NAICS 335929*) *Only part of this NAICS category
Major Demand Drivers • Wireless: • Mobile subscribers will surpass 7 billion in 2014. • The U.S. has invested a cumulative total of $378 billion in wireless networks, more than any other geographic region by a significant margin. • Although North America has been the most aggressive in launching 4G services, by 2018, the focus will shift to Asia. • Smartphones will account for over 60% of all handsets sold worldwide in 2014. Emerging markets represent a tremendous growth opportunity for high capacity mobile broadband networks. • Broadband: • Only 35-40% of households worldwide have a broadband connection, with 1.1 billion households – or 4.4 billion people – remaining unconnected in 2014 (ITU). • While broadband penetration hovers around 65-70% of households in developed regions like North America and Western Europe, it is 25% in emerging markets in Asia Pacific and merely 13% in Africa and the Middle East. • Mobile broadband is now more affordable than fixed broadband, and is the fastest growing segment of the global ICT market, by a 3:1 margin.
Mobile Economy to Triple in Size by 2017 Source: Pyramid Research
Global LTE Network Growth & Forecast Global LTE Network Growth & Forecast
Wireless Subscriber Distribution by World Region Subscription Distribution by World Region
Top International MarketsGlobal Telecom Market Value $2.1 Trillion Source: IDC Blackbook
Global Telecom Market Top Foreign Markets Valued Around $869 Billion; 41% of Global Telecom Market Source: IDC Blackbook
U.S. Exports of Communications Network and Transmission Equipment
CAGR for Top CNTE Export Markets: (Figures based on Year-End 2013)
Strategic Priorities Historically #1 for product reliability, quality and safety U.S. communications products are recognized globally as being world leaders. Monitor Government Activities in Emerging Markets Countries seeking to develop competing products frequently rely on policies which are discriminatory and/or run afoul of WTO rules. Competitive U.S-Based SMEs While the largest U.S. firms are successful internationally, many SMEs need assistance in accessing and navigating participation in foreign markets. • Expansion of the WTO Information Technology Agreement to provide duty-free treatment to additional products. • Elimination or reduction of forced localization requirements in key priority markets (China, India, Brazil). • Opening China market for telecommunications products—ongoing effort in the context of the JCCT. Pillars of Export Competitiveness
Opportunities • U.S. communications network and transmission equipment manufacturers should see continued global demand for their products. • Global population is expected to reach 9 billion by 2050. • Middle class populations in many emerging economies are expanding rapidly, as well. • U.S. manufacturers are leading global producers of new technologies to meet expanding global demand for communications. • Expansion of the WTO Information Technology Agreement to cover new technologies.
Risks and Issues • Foreign governments seek to create/bolster their domestic industries create programs to subsidize their manufacturers. • Import substitution and localization efforts in key emerging markets are important roadblocks. • Slower economic recovery in Europe and many emerging economies has been a drag on exports. • Efforts to expand the WTO Information Technology Agreement have been stalled since last fall due to China’s prohibitively long list of products to be excluded from duty-free treatment.
Competitive Environment: BRIC Market Access • Brazil: Local content, tariffs, NTBs, industrial policy • Russia: Tariffs, financial restrictions, local content • China: Intellectual property, industrial policy • India: Forced localization and burdensome testing
Inward Investment Communications Equipment: Samsung (Korea) Electronics Assembly: Foxconn (Taiwan)