Download
1 / 40
400 likes | 537 Vues
Jeddah Economic Forum 2012 – Session Content. Jeddah Chamber of Commerce & Industry. Confidential. March 2012. Contents. Agenda Day 1: Beyond Borders Day 2: Regional Priorities Day 3: Arabian Future. Event overview. The event will be held over three days in March 2012

E N D
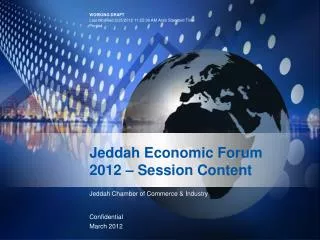
Jeddah Economic Forum 2012 – Session Content Jeddah Chamber of Commerce & Industry Confidential March 2012
Contents • Agenda • Day 1: Beyond Borders • Day 2: Regional Priorities • Day 3: Arabian Future
Event overview • The event will be held over three days in March 2012 • The theme and topics for the event are divided as follows: • Day 1 ‘Beyond Borders,’ with a focus on global macroeconomic forces and opportunities for regional cooperation • Day 2 ‘Regional Priorities,’ with focus on the key enablers for economic growth in the region, namely education, employment and entrepreneurship • Day 2 ‘Arabian Future,’ with a focus on key opportunities for Saudi Arabia, namely creating globalised brands, reforming philanthropy, and harnessing the positive impact of social networking by youth
Other Leader sessions will take place from 4.15 to 5.30 pm each day Agenda – JEF 2012 Day 1: Beyond Borders Day 2: Regional Priorities Day 3: Arabian Future Session 1: 09:30 – 11:15 Beyond BRICs: Seeking economic growth in an era of debt Transforming Education: Enabling the next generation Brand Arabia:Globalising regional value creation Session 2: 11:30 – 13:00 Building Blocs: A global re-focus on models of regional cooperation Transforming Employment: The job creation imperative Arabian Philanthropy: Enhancing the art of ‘giving back’ to society Session 3: 14:15 – 15:45 GCC Consolidation: Analysing the economics of greater GCC integration Transforming Entrepreneurship: Accelerating regional entrepreneurship Arabian Generation:Harnessing the positive impact of social networking by youth
Contents • Agenda • Day 1: Beyond Borders • Session 1: Beyond BRICs • Session 2: Building Blocs • Session 3: GCC Consolidation • Day 2: Regional Priorities • Day 3: Arabian Future
Key messages Key questions • If Europe falls into recession, and the US remains weak, will BRICs be able to maintain growth momentum? • How do growth prospects of emerging countries differ by region (especially Africa and Asia)? • What are the implications of emerging market growth for the GCC (e.g. trade, tourism, oil demand)? • What is needed to maintain the region’s competitive advantage as a global hub for trade (e.g. regulation, labour market, political stability)? • What are the political/ foreign policy implications of increased trade flows between the GCC and emerging markets? • As the world recovers from the first global recession in 60 years, developed economies continue to increase their leverage • Investments are shifting away from developed economies and toward developing countries • Still, recently there are increasing concerns about BRICs’ ability to maintain growth momentum • The GCC is strategically positioned to play a role of intermediary between developed and developing countries Day 1, Session 1: Beyond BRICs—Overview
Gross government debt Day 1 – Session 1: Beyond BRICs Government debt in developed countries has increased sincethe start of the crisis and is expected to grow further 2011 2015F % of GDP, 2011 and 2015F >90%“danger zone” Japan Greece Italy Ireland Portugal United States France Germany United Kingdom Spain Debt, 2007% of GDP 188 105 104 25 68 62 64 65 44 36 Source: International Monetary Fund; Global Institute
Day 1 – Session 1: Beyond BRICs Deleveraging typically begins in the private sector, even as government debt continues to grow Average of Swedish and Finnish deleveraging episodes Deleveraging Recession Private debt/ GDP Real GDP Public debt/ GDP Pre-crisis period Early stage of recession Private-sector deleveraging Rebound and public-sector deleveraging Time 10 years 1–2 years 4–6 years ~10 years Real GDP growth Annual average (%) 3% -3% 1% 3% Change in debt/GDP Percentage points 60 8 -26 87 • Private sector 3 15 21 -30 • Public sector Source: International Monetary Fund; Haver Analytics
Emerging markets are expected to account for an increasing share of global GDP Day 1 – Session 1: Beyond BRICs OECD Non-OECD OECD/ non-OECD global nominal GDP % of total 1987 2010 2015 16 31 41 Source: EIU
Contents • Agenda • Day 1: Beyond Borders • Session 1: Beyond BRICs • Session 2: Building Blocs • Session 3: GCC Consolidation • Day 2: Regional Priorities • Day 3: Arabian Future
Day 1, Session 2: Building Blocs—Overview Key messages Key questions • Regional integration aims at increasing economic growth, and ensuring political, economic and social stability; however with some risks associated with it that need to be mitigated • Regional integration can happen at six different levels: • Free trade area • Customs Union • Single market • Monetary union • Economic union • Social & political union • Regional integration is limited today, with the except of Europe & Asia, and most emerging regional blocs have started with trade liberalization • Is regional integration always desirable? What potential benefits and risks can be derived from it? • Why has regionalism not happened to a greater extent thus far in most parts of the world? • What lessons are we learning from the EU experience? • What is the future potential for African and Asian blocs? • If Africa becomes an important bloc, what impact will it have on the Middle East and Asia? • To what extent does regionalism foster protectionism?
Free Trade area 1 Customs Union 2 Single market 3 Monetary Union 4 Economic Union 5 Day 1 – Session 2: Building blocs Increased regional cooperation comes along six dimensions, with institutional, infrastructural, regulatory, and budgetary support Dimensions ofregional integration Definition Tools • Removal of tariffs on goods within country members Institutions/ leadership • Setting up of a common external tariff for external trade Infrastructure • Free movement of goods, services, capital and people within the regional bloc • Adoption of a single currency and transfer of power to a common central bank Laws and regulation • Economic integration through the adoption of financial, fiscal, industrial, and agricultural policies Social and political Union • Creation of a supranational government defining military policy, giving citizens the right to vote and harmonizing social policies, including education and health within participating countries Budget 6 Source: Literature search
Day 1 – Session 2: Building blocs There are benefits and risks associated with additional consolidation Areas of consolidation Benefits Risks Trade of goods, services, and capital • Economies of scale • Increased competition and efficiency improvement • Better FDI attractiveness • Loss of government revenues from tariffs • Changes in the location of production based on comparative advantages • Some industries need to be mature enough to face competition Labor • Better allocation of workers across region which reduces labor shortages or unemployment • Reduction of wage Inflation • Asymmetries in economies may incur loss of best skilled workers in certain countries • Social issues such as transfer of pensions and social benefits, entitlements of migrant workers to unemployment, social security Currency Union • Reduction in transaction costs • Consolidation of the Single Market, & end of destabilising currency shifts • Price convergence and stability • Lack of flexibility at the National level to fix unemployment, inflation, and recessions issues can incur major challenges Legal • Enabler of other coordination areas and a means to mitigate potential risks from other areas of coordination • States are less and less free to define their own laws in cases where the common law comes first Political structure • Ability to harmonize policies across member States to ensure success of coordination measures • Lack of flexibility to respond to each country’s specific issues • Giving up some level of policy freedom for individual states
Nonexistent High EU: “Political and economic bloc” ASEAN: “Economic cooperation” MERCOSUR Day 1 – Session 2: Building blocs Different models of regional integration have emerged, all of them initially focusing on trade liberalization Degree of coordination Currency/Fiscal Security andDefense Sector-specific Political structure Integration Models Trade Labor Legal
Nonexistent High Day 1 – Session 2: Building blocks The European experience brings an example of high integrationwith mixed results Degree of regional integration Facts Comments Countries: • EU-271 Trade • Some sectors (like public services) are still subject to the national laws Creation: • May 9, 1950 Objective: • Peace & stability; bringing Europe together; economic & social solidarity; safety; security; unity in diversity Labor • Restrictions exist in activities under the prerogative of public authorities (police, armed forces, foreign affairs etc.) Currency • Euro is the single currency of the Euro Zone (17 out of 27 countries) Model of Regional integration: • More than just a confederation of countries, but not a federal state Security • Internal borders completely opened up • In area of defence, each country remains sovereign Next steps: • Introduce simplified working methods and voting rules, ensure fundamental rights through a charter, and allow EU to speak with one voice on global issues Sector specific • Liberalization of energy, services and telecommunications still intended Main achieve-ments and failures: • Single market is one of the EU’s greatest achievements • Single market has not yetbecome single economic area • Individual EU countries still largely are responsible for taxation and social welfare Legal • Many different judicial systems still operate side by side in the EU, each within national borders Political structure • If an objective can be sufficiently achieved by the member states alone then EU does not take action 1 EU-27 includes Austria, Belgium, Bulgaria, Cyprus, Czech Republic, Denmark, Estonia, Finland, France, Germany, Greece, Hungary, Ireland, Italy, Latvia, Lithuania, Luxembourg, Malta, Netherlands, Poland, Portugal, Romania, Slovakia, Slovenia, Spain, Sweden, and United Kingdom Source: www.europa.eu
Contents • Agenda • Day 1: Beyond Borders • Session 1: Beyond BRICs • Session 2: Building Blocs • Session 3: GCC Consolidation • Day 2: Regional Priorities • Day 3: Arabian Future
Day 1 – Session 3: GCC consolidation Day 1, Session 3: GCC consolidation - Overview Key messages Key questions • Since its creation in 1981, the GCC has transformed into a common market for labor, trade and capital • GCC integration has been facilitated by a number of common features shared by each country member • Over the past 10 years, GCC initiatives have contributed to developing trade and economic growth in the region • In 2012, GCC’s initial priorities have only partially been achieved • Are GCC countries willing to further integrate economically and politically? If so, why hasn’t it happened so far? • What might be the main objectives for pursuing greater GCC integration? • What measures might best support these objectives over the next 5-10 years? • What would be the benefits and risks of each measure? • What common challenges could be addressed by the GCC? • How do we define GCC membership (rules, agencies, laws, rights, etc.) • Who should lead the new initiatives? What governance structure should it be? What transfers of power would it imply? • What would it mean for the GCC to morph into a “Union”?
"Effect coordination, integration and inter-connection between Member States in all fields, strength-ening ties between their peoples, formulating similar regulations in various fields such as economy, finance, trade, customs, tourism, legislation, administration, as well as fostering scientific and tech-nical progress in industry, mining, agriculture, water and animal resources, establishing scientific research centers, setting up joint ventures, and encouraging cooperation of the private sector" Day 1 – Session 3: GCC consolidation Overview of GCC Countries Kuwait Oman KSA UAE Bahrain Qatar History • Formed in May 1981 • In 1984, the GCC created an embryonic collective defense force – the Saudi-based Peninsula Shield, and signed an intelligence-sharing pact in 2004, aimed at countering terrorism • GCC's common market came into existence early in 2008. There were plans to adopt a single currency in 2010, but these were later shelved • A customs union was set up in 2003, though by the end of 2010 it was being predicted that this might not be fully implemented for another few years Initial objec-tives Key facts and figures • Total population: 43m • Combined nominal GDP of: ~USD 1tn • Average GDP per capita: USD 36K • Oil production: 16m bbl/day Source: GCC Website; BBC; Worldbank
Contents • Agenda • Day 1: Beyond Borders • Day 2: Regional Priorities • Session 1: Transforming Education • Session 2: Transforming Employment • Session 3: Transforming Entrepreneurship • Day 3: Arabian Future
Day 2, Session 1: Transforming Education Key messages Key questions • MENA countries lag behind peers across standardized assessments and students are not adequately prepared for the workforce • While there is consensus on the corrective measures, these countries face natural challenges to implement effective transformation programs • MENA countries can take heart from case examples of successful, rapid transformation programs • What should parents/society expect from an educational system? What is its purpose? • What are the priorities for education reform, and how should success be measured? • What are the key lessons to be learned from successful education reform initiatives around the world? • How can lessons from implementation success stories be applied in the regional context? • What would a PPP strategy for vocational education look like? How could this be rolled out on a large scale, and are there any international experiences to learn from? • What would a delivery unit for education system reform look like (relevant stakeholders, organisational structure, funding mechanism)?
Day 2 – Session 1: Transforming Education MENA countries lag behind their peers on standardized international assessments Science Math Eighth grade TIMMS scores 20071 Singapore Japan US Italy Lebanon Bahrain Egypt Kuwait KSA 1 Latest global TIMMS assessment Source: TIMMS
Day 2 – Session 1: Transforming Education University specialties are skewed towards education and humanities, and are not aligned with job market needs Distribution of university students by field of study Percentage of students, 2010 • Compared to benchmarks, too many university students in MENA countries study education and humanities, at the expense of professional and scientific subjects • Our surveys of 1,500 employers indicate that while this mix may have been appropriate historically for securing employment within the public sector, it is no longer appropriate for today’s job market needs Other Medicine Scientific, technical and engineering 18 31 24 Social sciences Education andhumanities 37 20 17 MENA1 Asia2 Latin America3 1 Represented by Algeria, Iraq, Jordan, Morocco, Egypt, Oman, Saudi Arabia, and Palestinian Territories 2 Represented by China, Indonesia, Malaysia, Korea, Philippines, Thailand 3 Represented by Argentina, Bolivia, Chile, Brazil, Colombia, Mexico, Peru Source: World Bank, E4E Employer Survey 2010 (n=1,500)
Success Failure Day 2 – Session 1: Transforming Education Consensus exists on the necessary measures to improve education;the main problem is implementation Consensus exists on the necessary policy measures needed to improve education… … yet policy measures are rarely successful in delivering change on the ground Outcome of large-scale transformation programs Percentage Description Improve teacher quality • Attract higher-caliber teaching candidates through selection process, salaries and professional development opportunities • Improve education and training for teachers to include more practical experience and peer coaching Program objectivesachieved Employee resistance 30 Improve performance management • Improve monitoring and assessments to understand student and school performance • Improve data management in terms of collection, use and distribution (e.g. publication) Other obstacles Senior managementbehavior does notsupport change Involve private sector employers • Introduce mandatory work experience in higher and vocational education • Increase PPPs in providing training and curriculum-design Insufficient resources/ budget Source: Beer and Nohria (2000), Cameron and Quinn (1997), CSC Index, Caldewell (1994), Gross et al. (1993), Kotter and Heskett (1992), Hickings (1988), Conference Board report (Fortune 500 interviews), press analysis
Contents • Agenda • Day 1: Beyond Borders • Day 2: Regional Priorities • Session 1: Transforming Education • Session 2: Transforming Employment • Session 3: Transforming Entrepreneurship • Day 3: Arabian Future
Day 2, Session 2: Transforming Employment Key messages Key questions • Unemployment rates in MENA are the highest in the world, with youth rates particularly alarming • Immigration policy, labor market regulations, and labor market institutions are the 3 most relevant types of interventions for the MENA region • How do levers for employment creation differ within the region? • What innovations in employment creation interventions are being pursued in the region, and with what success? • What are best practices in nationalisation policies, and how can such policies be improved? • How could an integrated job-seeker system aid matching, and what is an optimal design for such an integrated structure? • How can MENA countries leverage innovations in IT to improve employment creation interventions?
Day 2 – Session 2: Transforming Employment Unemployment in MENA is the highest in the world, withyouth unemployment at particularly alarming rates Total Youth Global unemployment Percentage of total labour force aged 15-64 and youths aged 15-24, 2011 Global youth average = 13 Global overall average = 6 Middle East North Africa Eastern Europe & CIS Developed countries Sub-Saharan Africa Latin America Southeast Asia South Asia East Asia Source: ILO Global Employment Trends 2011
Day 2 – Session 2: Transforming Employment Creating employment can be achieved by interventions on 3 key dimensions Most relevant to GCC • MARKET CLEARANCE • Labour market regulation • Price regulation (e.g. taxation, wage subsidies) • Quality regulation (e.g. nationalisation policies) • Labour condition regulation (e.g. termination rigidity) • Labour market institutions • Matching support • Re-training • Incentives through welfare system (e.g. conditional unemployment benefits) • LABOURSUPPLY • Education • Vocational training • Policies to promote participation, esp. of women • Cultural considerations • Immigration policy • Quotas/ levies • Skills differentiation • LABOUR DEMAND • Government job-creation initiatives • General regulation (e.g. ease of doing business) • Sectoral/ regional policies (e.g. shift to labour-intensive sectors)
Contents • Agenda • Day 1: Beyond Borders • Day 2: Regional Priorities • Session 1: Transforming Education • Session 2: Transforming Employment • Session 3: Transforming Entrepreneurship • Day 3: Arabian Future
Day 2, Session 3: Transforming Entrepreneurship Key messages Key questions • MENA countries have very low rates of early-stage activity, translating into smaller entrepreneurial clusters than other countries • Many factors contribute to an entrepreneurial ecosystem, including access to finance, regulatory environment, and SME support • What are the key bottlenecks to developing entrepreneurship within the region? • What initiatives have other countries launched to promote entrepreneurship, and how can their experiences be applied to the MENA context? • How can MENA countries use IT and social networking to promote learning among entrepreneurs? • What measures are needed to promote entrepreneurship and innovation within existing large companies? • Public sector: competition policy, regulation • Private sector: incentives to employees, organisational structure
Day 2 – Session 3: Transforming Entrepreneurship Early-stage entrepreneurial activity in MENA is low compared to other factor-driven economies1 Nascent entrepreneurship rate Percentage of 18-64 adult population New business ownership rate Percentage of 18-64 adult population Guatemala Uganda Venezuela Guatemala Jamaica Kingdom of Tonga Uganda Jamaica Algeria Morocco Morocco Lebanon Lebanon Algeria Kingdom of Tonga Venezuela Syria Syria Saudi Arabia Saudi Arabia 1 GEM classified countries as factor-driven, efficiency-driven or innovation-driven economies, in line with Global Competitiveness Report classifications by WEF Source: Global Entrepreneurship Monitor 2009
Finance Support for SMEs Day 2 – Session 3: Transforming Entrepreneurship Creating a strong ecosystem is paramount to entrepreneurship and SME success Regulatory environment • Foreign direct investment • Openness to trade • Competition policy • “Ease of doing business” • Registration procedures • Taxes • Enforcing contracts • Incentives for venture capitalists • Public finance/ loans • Access to (micro-)credit • Support infrastructure • Incubators • Professional services • Training/ capability building • Facilitate networks for entrepreneurs • Challenging/ coaching • Competition/ cooperation
Contents • Agenda • Day 1: Beyond Borders • Day 2: Regional Priorities • Day 3: Arabian Future • Session 1: Brand Arabia • Session 2: Arabian Philanthropy • Session 3: Arabian Generation
Day 3, Session 1: Branding Arabia Key messages Key questions • Companies brand themselves to become “bigger” and “stronger”, and world brands have historically shown stronger financial performance • Most companies in the Middle East have predominantly domestic presence and little/no international presence • Successful global brands are defined by strong recognition, consistency, and the ability to compete along emotional dimensions • Some KSA companies have successfully began the journey of international branding – some have relied on premium positioning, product innovation, and providing a full brand experience • Companies expand globally in 3 ways: serial acquisition, transformational acquisition, and organic growth (least common method for global brands) • What are the economic & cultural benefits of branding both to the company itself and to the country? • What does it take for companies to “go big”? What is within the company’s control vs. government’s or other institutions’? • What is the main barrier/obstacle keeping KSA companies from branding themselves globally and expanding? How did other companies break that barrier and became global names? • How can KSA encourage branding both through financial incentives and other facilitations? • What is the potential upside on KSA’s economy if it’s top companies branded themselves globally and expanded internationally? • What are some potential risks when it comes to branding & expanding?
916 Successful branding & globalization is rewarding in the long term TRS, indexed Examples Global Champions Index1 FTSE World2 1 Monthly TRS of global champions weighted by market value 2 FTSE World Index is weighted by market capitalization; however, only free float is taken into consideration Source: Research Insight (Compustat and Global); Bloomberg; Datastream; G2000 database
Value of 100 Best Global Brands $ billion Middle East brands are no where to be seen on the best 100 global brands Origin of 100 Best Global Brands Best Global Brands 2011 Other2 Italy Coca-Cola (1) Netherlands UK IBM (2) Switzerland USA Microsoft (3) France Google (4) 7 Japan Toyota (11) Germany Samsung (17) Japan & South Korea have developed a number of high- value brands in past 10 to 20 years Honda (19) Harley Davidson (100) 1 2011 values are shown where available 2 … Source: Zawya; Best Global Brands 2006
What does it take for companies to go global? CHINESE COMPANIES EXAMPLE Globalization strategy • Start the journey with a strategy-answer "why, where, and how" questions. Never do it out of peer pressure Globalization execution Inorganic execution • Have a team in place, get into the inner circles of deal flows, screen tar-gets frequently and rigorously • Fully understand labor and pension-related liabilities and manage them; take TSA into account in case of carve-out Organic execution • Spend time to select the right partner and manage the relationship • Invest in brand building Overarching issues • Assess all funding options; know how to leverage private equity • Manage "non-business factors/stakeholders" – government, union, and general public, etc.; get good advice and get it early Managing global business • Recruit and develop the best talents for your global leadership • Proactively manage cultural integration issues • Evolve organization and processes to manage the increased complexity Note: There are many more China-specific challenges – refer to publications for more information
There are three main ways in which companies expand globally When relevant Examples Transforma-tional acquisition • Global industry with economies of scale • Rare, “made-in-heaven” target available – match of complementary capabilities, assets, geographies • Risky, rarely used • IBM – Lenovo • Tata – Corus Steel • Doosan – Ingersoll Serial acquirer • Most frequently adopted globalization strategy • Used when access required to multiple geographies and capabilities in globalization effort; and no single acquisition can meet this aspiration • Less risky, allows acquirer to enhance value creation capability over time • Ranbaxy • Mittal • Chalco • Sinopec, • Petrochina • Bluestar Predominantly organic • Proprietary business model/technology • Fear of failure in inorganic route due to post experience • Toyota • LG
Contents • Agenda • Day 1: Beyond Borders • Day 2: Regional Priorities • Day 3: Arabian Future • Session 1: Brand Arabia • Session 2: Arabian Philanthropy • Session 3: Arabian Generation
Day 3, Session 2: Arabian Philanthropy Key messages Key questions • The philanthropic sector can be a meaningful contributor to the GDP • In KSA, philanthropic support flows through private donors, philanthropies, NGOs, and the Ministry of Social Affairs • There are 5 key success criteria for philanthropic impact: significant depth, sufficient breadth, relatively fast speed of impact, sustainability, and focus • The top global foundations have specific focus areas regardless of their asset size • The KSA philanthropic landscape can be improved via activities that require more time instead of money – mainly through research, capacity development, advocacy, and networking. • What does it take a philanthropic organization to be successful (both institutionally and in terms of impact)? • What are the main challenges facing the philanthropic landscape in KSA today? • How do we ensure alignment between government spend and philanthropic activities? How do we create alignment across philanthropies? • What are key enablers to improve impact efficiency of philanthropic spend? What are key enablers for philanthropies to improve channelling of public and other private spend? • How do we shift mindsets for donors to view investment of time as a necessary complement to spending money?
The philanthropic sector can be a meaningful contributor to GDP US EXAMPLE Size and importance of the philanthropic sector as measured by: Value-added to U.S. GDP in comparison to selected industries 20072 US GDP 2008 100% = $12.487 trillion $ bn Manufacturing 1,617 Real Estate 1,587 Other Philanthropy State and local government 1,189 Private households 2 Finance and insurance 1,091 Retail 893 Federal, state, and local government Wholesale 805 Construction 611 Federal government 554 Transportation 407 Insurance 333 Philanthropy 291 Utilities 281 Business Legal Services 198 Agriculture, forestry, and fishing 168 1 Estimated, includes educational services, hospitals and nursing and residential care facilities, social assistance, performing arts, spectator sports, museums, and related activities; analysis consistent with The Independent Sector, The Nonprofit Almanac 2008 2 Philanthropic data from 2010 Source: GDP contribution: U.S. Department of Commerce, Bureau of Economic Analysis, NIPA table 1.3.5; Industry comparison: U.S. Bureau of Economic Analysis Gross Domestic Product by Industry Accounts, 2008