Download

1 / 91
910 likes | 1.11k Vues
FRMS Forum, September 2011, Montreal. DRAFT, not for distribution!. Analysis of FRMS Forum data using BAM 2 September 2011. Tomas Klemets, Head of Scheduling Safety, Jeppesen. www.jeppesen.com/frm. Content. Background and Purpose About BAM Features / Capabilities / Limitations

E N D
FRMS Forum, September 2011, Montreal DRAFT, not for distribution! Analysis of FRMS Forum data using BAM 2 September 2011 Tomas Klemets, Head of Scheduling Safety, Jeppesen www.jeppesen.com/frm
Content • Background and Purpose • About BAM • Features / Capabilities / Limitations • Analysis of data provided • Upcoming functionality
Jeppesen and Jeppesen Crew Solutions • 3,000 employees • Denver, Frankfurt, Gothenburg, Montreal, Singapore, New York, Brisbane... • Navigation, Flight planning, and: • Crew Solutions: 500 people focused entirely on crew management. • Affecting some 250,000 crew daily. • Mostly crew planning, but also day-of-ops solutions
Why a need for models and BAM? • Regulatory rule sets, as well as union/pilot agreements are really binary fatigue models • Perfectly safe / Perfectly un-safe • Alignment with current science is so-so... • What you can’t measure... • Mathematical prediction models, even if not perfect, provides a continous metric... • ...to be used for influencing, to push, an overall collection of crew schedules away from unneccessary fatigue • Crew scheduling with a metric for human physiology!
The science behind BAM • Based on the Three Process Model of Alertness by Åkerstedt / Folkard • Predicts sleepiness • Sleep prediction enhanced to better reflect flight operation and take sleep oppurtunity into account • No published validation studies to date on airline crew but straightforward for an airline to check applicability • Returns continous predictions on a scale 0-10,000 • High resolution a need for optimization • KSS , easy to close the loop The Karolinska Sleepiness Scale - KSS The Common Alertness Scale - CAS
BAM features • BAM is built to support the complex crew management processes for airlines of all sizes. • Integration with industry strength optimizers generating up to 6000 rosters per second over many hours • Initial state assumptions for pairing construction • Augmentation, acclimatisation... • Customizability • Habitual sleep length, Diurnal type,Transfer times • Sleep/wake overrides • Prediction point
BAM features (2) • CAPI compliant – easy to connect and exchange • Usable in a more comprehensive risk layer taking mission context into account: weather, airport properties, crew experience, light conditions, etc... • Limitations • Predicts the average of a population • Does not take actual light conditions into account, approximates via time zone • Sleep inertia is not implemented • BAM (as any model?) should primarily be used to rank relative fatigue between flights
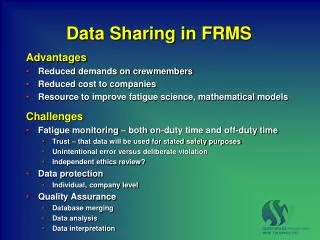
BAM evolution • BAM is built to self-tune in a closed-loop system to collected data • Airline collections • Crowd sourcing (FDC 2011)
The task: Pairings Rosters A B 1094 / 90 [flights / chains] 3693 / 56 Short haul C D 188 / 47 1006 / 64 Long haul 1. Which are the worst flights and why? Example also of good ones. 2. Which are the worst pairings/rosters and why? Examples also of good ones. (Ignore mission context – all flights are equally ”difficult”).
Tools used for the analysis CFAS CrewAlert Scenarios
Analysis data set A – short haul pairings
Some of the worst flights *) A *) From a fatigue risk perspective ignoring mission difficulty Time of day. Slight sleep deprivation previous night, no/little chance for afternoon sleep when departing home 15:46. Many consecutive days and sectors adds a bit to the problem. 615
Some of the worst flights (2) A Time of day. Slight sleep deprivation previous night, no/little chance for afternoon sleep when departing home 15:46. Many consecutive days and sectors adds a bit to the problem. 618
Some of the worst flights (3) A Time of day. Slight sleep deprivation previous night, no/little chance for afternoon sleep when departing home 15:46. Many consecutive days and sectors adds a bit to the problem. 769
Some of the worst flights (4) A Time of day. Sleep deprivation from falling asleep at 3AM. Many consecutive days and sectors adds a bit to the problem. 1154
Some of the worst flights (5) A Time of day. Two-pilot operation through the WOCL. Sleep deprivation. 2h acclimatisation west – but small effect. 1169
A Day time. Sensitive to early sleep in the evenings due to early starts. >5000
A Day time. Long duties, but well placed. >5000
Risk... • The operational risk we try to adress is for a flight to suffer an ”adverse event” with crew fatigue as a contributor or a direct cause • A flight! • The total operational risk (of this type) for the airline is the sum over all flights. • Most likely a weighted sum... • A pairing or a roster can rarely be modified in isolation! • All flights in a crew scheduling problem need to be assessed at once...
Risk for a flight vs. risk for a pairing or a roster... • Lowest point during a flight, top of descent, average, or time below treshold. • Doesn’t really matter when reshuffling a sequence of flights! • What is worst? (recall low is bad...) • Pairing 1; active flights on 600, 3000, 3300, 2700 • Pairing 2; active flights on 700, 700, 700, 700
The operational risk for an airline... CP hour on type CP hours total CP airport recency CP predicted alertness FO hour on type FO ... Airport elevation Runway length Light conditions Wind direction/force Rain/hail/snow Visibility Airport equipment Airport terrain Airport traffic Aircraft MEL items ... (More on this in the proceedings from IASS 2009)
BAM and operational risk • There is no sharp threshold on predicted alertness where risk suddenly goes from non-existant to non-acceptable • Risk grows exponentially when approaching 0 • BAM is built to adress also the total risk • All flights in the lower tail of the alertness distribution makes sense to improve R A
BAM and operational risk (2) • When constructing pairings and rosters – one alertness value per flight is sufficient • BAM is configurable and supports using either: • Lowest point during flight • Lowest point during a customizable part of the flight • Prediction at a certain point in the flight – like TOD • (True fatigue risk management takes mission difficulty into account when prioritising crew assignments.)
Analysis data set B – short haul rosters
B >5000
B >3000
B Example that it does not have to be that bad >xxx
... • <added later>
Analysis data set C – long haul pairings
C >5000