Download
1 / 43
500 likes | 828 Vues
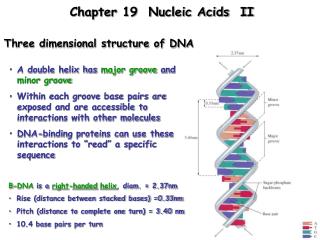
Figure 5-12 Watson-Crick base pairs. Figure 5-11 Three-dimensional structure of B-DNA. http://rutchem.rutgers.edu/~xiangjun/3DNA/images/bp_step_hel.gif. Twist varies with sequence. Note: importance of sequence > importance of composition.

E N D
Figure 5-12 Watson-Crick base pairs. Figure 5-11 Three-dimensional structure of B-DNA.
http://rutchem.rutgers.edu/~xiangjun/3DNA/images/bp_step_hel.gifhttp://rutchem.rutgers.edu/~xiangjun/3DNA/images/bp_step_hel.gif
Twist varies with sequence. Note: importance of sequence > importance of composition.
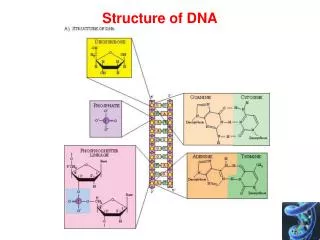
Figure 29-9b Sugar ring pucker. (b) The steric strain resulting in Part a is partially relieved by ring puckering in a half-chair conformation in which C3¢ is the out-of-plane atom. Figure 29-7 The conformation of a nucleotide unit is determined bythe seven indicated torsion angles.
Table 4.T02: Comparison of Major Features in A-, B-, and Z-Forms of DNA Adapted from Ussery, D. W. Encyclopedia of Life Sciences. John Wiley & Sons, Ltd., May 2002. [doi: 10.1038/npg.els.0003122].
Figure 29-10a Nucleotide sugar conformations. (a) The C3-endo conformation (on the same side of the sugar ring as C5), which occurs in A-RNA and RNA-11. Figure 29-10b Nucleotide sugar conformations. (b) The C2-endo conformation, which occurs in B-DNA. Greater flexibility of B-DNA allows it to exhibit significant variation in the configuation of its sugar pucker under in vivo conditions. But see: http://www.chem.qmul.ac.uk/iupac/misc/pnuc2.html
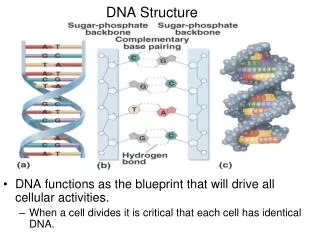
~10 bp/turn- right handed Pitch of 34 Angstroms Wide major groove Narrow minor groove Structure adopted by Real DNA deviates from ideal structure in a sequence-specific manner. Figure 29-1a Structure of B-DNA. (a) Ball and stick drawing and corresponding space-filling model viewed perpendicular to the helix axis.
Figure 4.04a: The C2’-endo conformation Adapted from Voet, D., and Voet, J. G. Biochemistry, Third Edition. John Wiley & Sons, Ltd., 2005.
Figure 4.04b: The C3’-endo conformation Adapted from Voet, D., and Voet, J. G. Biochemistry, Third Edition. John Wiley & Sons, Ltd., 2005.
Figure 29-1b Structure of B-DNA. (b) Ball and stick drawing and corresponding space-filling model viewed down the helix axis.
Figure 4.01a: A-DNA Protein Data Bank ID: 213D. Ramakrishnan, B., and Sundaralingam, M., Biophys. J. 69 (1995): 553-558 (top).
11.6 bp/turn- right handed Pitch of 34 Angstroms Deep major groove Very shallow minor groove Structure adopted by A-RNA (aka. RNA-11) Figure 29-2a Structure of A-DNA. (a) Ball and stick drawing and corresponding space-filling model viewed perpendicular to the helix axis.
Figure 29-2b Structure of A-DNA. (b) Ball and stick drawing and corresponding space-filling model viewed down the helix axis.
Figure 4.01b: B-DNA Protein Data Bank ID: 1BNA. Drew, H. R., et al., Proc. Natl. Acad. Sci. USA 78 (1981): 2179-2183 (middle).
12 bp/turn- left-handed helix Pitch of 44 Angstroms No major groove Deep minor groove Structure adopted by Alternating Purine- Pyrimidine pairs (e.g., repeats of 2 bases pairs) Methylation of C favors formation, as does high salt conc. Genetic switch? Figure 29-3a Structure of Z-DNA. (a) Ball and stick drawing and corresponding space-filling model viewed perpendicular to the helix axis.
Figure 29-3b Structure of Z-DNA. (b) Ball and stick drawing and corresponding space-filling model viewed down the helix axis.
Figure 4.01c: Z-DNA Protein Data Bank ID: 2ZNA. Wang, A. H. J., et al. (bottom).
Figure 4.02a: Z-DNA with zig-zag sugar phosphate backbone shown in white Protein Data Bank ID: 2ZNA. Wang, A. H. J., et al.
Figure 4.02b: The same Z-DNA with the zigzag sugar phosphate backbone shown in space filling display Protein Data Bank ID: 2ZNA. Wang, A. H. J., et al.
Base pairs flipped by 180 degrees Repeat is d(pXpY) Polyd(GC)-polyd(GC) Polyd(AC)-polyd(GT) Anti-C or T Syn-G or A May form transiently behind actively transcribing RNA polymerase Figure 29-4 Conversion of B-DNA to Z-DNA.
Thought to targeted to Z-DNA upstream of actively transcribing genes Figure 29-5 X-Ray structure of two ADAR1 Z domains in complex with Z-DNA.
Figure 4.03: Drosophila (fruit fly) chromosomes with bound antibody to Z-DNA. Reproduced from Nordheim, A., et al., Nature 294 (1981): 417-422. Photo courtesy of Alexander Rich, Massachusetts Institute of Technology.
Forces stabilizing nucleic acid structure BASE PAIRING Geometric complementarity Electronic complementarity Book: contribute -2 to -8 kJ/mol of base pair Other sources: A=U/A=T -5 to -9 kJ/mol of bp G=C -13 to -21 kJ/ mol of bp Base pairs replaced by H-bonds to water of nearly equivalent strength when DNA is denatured. Non Watson-Crick H-bonding have little stability in dsDNA However, they do stabilize tertiary structure of tRNAs and have other roles (e.g., wobble base pairing in codon/anti-codon recognition.
Forces stabilizing nucleic acid structure BASE STACKING Van der Waals radii of aromatic ring ~1.7 angstroms Adjacent bases 3.4 angstroms apart in helix Contribute -4 kJ/mol Base stacking is responsible for the hyperchromic effect observed when dsDNA is denatured
Forces stabilizing nucleic acid structure HYDROPHOBIC FORCES Sugar-phosphates on outside interacting with water. Hydrophobic bases in interior Base stacking is enthalpically driven and entropically opposed Hydrophobic forces poorly understood Increases in ionic strength stabilizes dsDNA and dsRNA.
Figure 4.09: Effect of G-C content on DNA melting temperature.
Figure 4.10: Several effects of cooperativity of base-stacking.
Figure 4.11: The effect of lowering the temperature to 25°C after strand separation has taken place.
Figure 4.06a: Inverted repeats Adapted from Bacolla, A., and Wells, R. D., J. Biol. Chem. 279 (2004): 47411-47414.
Figure 4.06b: Cruciform structure Adapted from Bacolla, A., and Wells, R. D., J. Biol. Chem. 279 (2004): 47411-47414.
Figure 4.07: Hairpin RNA. Adapted from Horton, R. H., et al. Principles of Physical Biochemistry, Second Edition. Prentice Hall, 2006.
Hyperchromic effect- increase of 1.4xA260 upon denaturation of double-stranded nucleic Acids (dsDNA or dsRNA
Forces stabilizing nucleic acid structure • IONIC INTERACTIONS • Electrostatic repulsion of phosphates destabilize dsDNA structure • Effect counteracted or stabilized by cations -Metal ions: Na+, K+, Mg2+ -polyamines -basic proteins -Mg2+ effect 100-1000X of Na+ ions. ENTROPICALLY UNFAVORABLE Highly ordered Increase temperature= decrease stability Tm=41.1XG+C + 16.6log[Na+] +81.5