A Visualization System for Tidal Basins
Develop a system to graphically visualize tidal basins properties, aiding in coastal erosion analysis, pollution effects, and more. The system, utilizing 2D grids and time-based data, replaces manual Excel processes. Implemented using VB 6.0 with efficient system architecture and double buffering to prevent screen flickering. Prototyping and flexible design accommodated evolving client requirements with successful delivery. Learnings include VB programming, real product engagement, and the importance of clear requirements.

A Visualization System for Tidal Basins
E N D
Presentation Transcript
A Visualization System for Tidal Basins Kenrick Mock CS 470
System Overview • Goal • Develop a system to graphically visualize properties of tidal basins • Client is Coastal Engineering • Why • Visualization will aid in the analysis of coastal erosion, effects of pollution, navigational access, and other aspects of waterways • To visualize the system today, Coastal Engineering uses a manual process of loading data into Excel
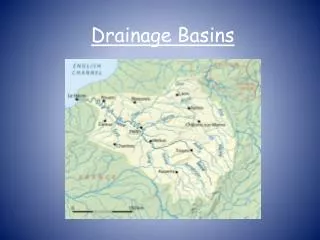
Data Files • Area of interest divided into 2D grid of cells. Five files containing source data. • Depth • Depth to basin floor, -99 to represent land • Elevation • Height of the water, indicates tide • U velocity • X velocity of water in a particular cell • V velocity • Y velocity of water in a particular cell • Concentration • Percentage of contaminant or other material in a particular cell
Data Source • Physical Model • Miniature version of the real thing • Computer Model • Fortran program • Most data in this project generated from a computer model
Data File Format • All files are in text • Depth file example • Mapping -99.00 -99.00 3.96 3.96 -99.00 3.96 3.96 3.96 -99.00 3.96 3.96 -99.0
Time-Based Files • Typically 2-5Mb in size • Value of each cell specified for a time period VERTICALLY AVERAGED BOD DAYS= 2.0833334E-02 HOURS= 0.5000000 -2.00 -2.00 1.00 1.00 -2.00 1.00 1.00 1.00 -2.00 1.00 1.00 -2.00 VERTICALLY AVERAGED BOD DAYS= 4.1666668E-02 HOURS= 1.000000 -2.00 -2.00 0.98 0.94 -2.00 0.98 0.95 0.93 -2.00 0.97 0.94 -2.00 VERTICALLY AVERAGED BOD DAYS= 4.1666668E-02 HOURS= 1.500000 -2.00 -2.00 0.94 0.92 -2.00 0.95 0.93 0.91 -2.00 0.94 0.87 -2.00
Visualization Using Excel • Import data, assign colors based on values • Slow! • Especially slow for time-based data • Solution: Program to automatically visualize data
Final Product • Jumping straight to the program that was created… • VB 6.0
How was this created? • System Design • For speed, load all data into memory • Depth file: 2D array • Time-based files: • Dictionary of 2D arrays • Simpler than a 3D array • Dictionary is like a dynamic, content-based vector
Addressing Flicker • A screen update while cells are being re-drawn for the next time step can result in unpleasant flicker • Use “Double Buffering” solution • Draw new cell colors on the hidden screen • Draw new vectors for velocities on the hidden screen • Copy entire hidden screen to the visible screen
Prototyping • Prototyping used since the client was not sure what they wanted • Somewhat fuzzy requirements led to some difficulties in implementation • Requirements changed • Had to add zoom, graphical slider synchronized with tide • Fortunately did not require major re-design • Wrong origin for vectors • Meticulously engineered code for arrowheads was thrown out
Conclusion • Successfully delivered a visualization system for tidal basins • I learned: • More about programming in Visual Basic, particularly with graphics • Experience working with a real product as opposed to an academic exercise • More rigorous requirements could have eliminated some trouble and re-work farther into the development process