Download

1 / 66
660 likes | 838 Vues
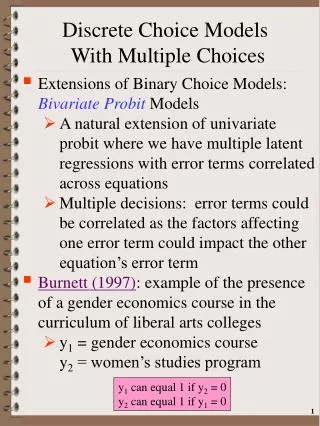
9. Heterogeneity: Latent Class Models. Latent Classes. A population contains a mixture of individuals of different types (classes) Common form of the data generating mechanism within the classes Observed outcome y is governed by the common process F( y| x , j )

E N D
Latent Classes • A population contains a mixture of individuals of different types (classes) • Common form of the data generating mechanism within the classes • Observed outcome y is governed by the common process F(y|x,j) • Classes are distinguished by the parameters, j.
How Finite Mixture Models Work Density? Note significant mass below zero. Not a gamma or lognormal or any other familiar density.
Approximation Actual Distribution
A Practical Distinction • Finite Mixture (Discrete Mixture): • Functional form strategy • Component densities have no meaning • Mixing probabilities have no meaning • There is no question of “class membership” • The number of classes is uninteresting – enough to get a good fit • Latent Class: • Mixture of subpopulations • Component densities are believed to be definable “groups” (Low Users and High Users in Bago d’Uva and Jones application) • The classification problem is interesting – who is in which class? • Posterior probabilities, P(class|y,x) have meaning • Question of the number of classes has content in the context of the analysis
The Technique Still Works ---------------------------------------------------------------------- Latent Class / Panel LinearRg Model Dependent variable YLC Sample is 1 pds and 1000 individuals LINEAR regression model Model fit with 2 latent classes. --------+------------------------------------------------------------- Variable| Coefficient Standard Error b/St.Er. P[|Z|>z] Mean of X --------+------------------------------------------------------------- |Model parameters for latent class 1 Constant| 2.93611*** .15813 18.568 .0000 Sigma| 1.00326*** .07370 13.613 .0000 |Model parameters for latent class 2 Constant| .90156*** .28767 3.134 .0017 Sigma| .86951*** .10808 8.045 .0000 |Estimated prior probabilities for class membership Class1Pr| .73447*** .09076 8.092 .0000 Class2Pr| .26553*** .09076 2.926 .0034 --------+-------------------------------------------------------------
LCM for Health Status • Self Assessed Health Status = 0,1,…,10 • Recoded: Healthy = HSAT > 6 • Using only groups observed T=7 times; N=887 • Prob = (Age,Educ,Income,Married,Kids) • 2, 3 classes
Two Class Model ---------------------------------------------------------------------- Latent Class / Panel Probit Model Dependent variable HEALTHY Unbalanced panel has 887 individuals PROBIT (normal) probability model Model fit with 2 latent classes. --------+------------------------------------------------------------- Variable| Coefficient Standard Error b/St.Er. P[|Z|>z] Mean of X --------+------------------------------------------------------------- |Model parameters for latent class 1 Constant| .61652** .28620 2.154 .0312 AGE| -.02466*** .00401 -6.143 .0000 44.3352 EDUC| .11759*** .01852 6.351 .0000 10.9409 HHNINC| .10713 .20447 .524 .6003 .34930 MARRIED| .11705 .09574 1.223 .2215 .84539 HHKIDS| .04421 .07017 .630 .5287 .45482 |Model parameters for latent class 2 Constant| .18988 .31890 .595 .5516 AGE| -.03120*** .00464 -6.719 .0000 44.3352 EDUC| .02122 .01934 1.097 .2726 10.9409 HHNINC| .61039*** .19688 3.100 .0019 .34930 MARRIED| .06201 .10035 .618 .5367 .84539 HHKIDS| .19465** .07936 2.453 .0142 .45482 |Estimated prior probabilities for class membership Class1Pr| .56604*** .02487 22.763 .0000 Class2Pr| .43396*** .02487 17.452 .0000
Partial Effects in LC Model ---------------------------------------------------------------------- Partial derivatives of expected val. with respect to the vector of characteristics. They are computed at the means of the Xs. Conditional Mean at Sample Point .6116 Scale Factor for Marginal Effects .3832 B for latent class model is a wghted avrg. --------+------------------------------------------------------------- Variable| Coefficient Standard Error b/St.Er. P[|Z|>z] Elasticity --------+------------------------------------------------------------- |Two class latent class model AGE| -.01054*** .00134 -7.860 .0000 -.76377 EDUC| .02904*** .00589 4.932 .0000 .51939 HHNINC| .12475** .05598 2.228 .0259 .07124 MARRIED| .03570 .02991 1.194 .2326 .04934 HHKIDS| .04196** .02075 2.022 .0432 .03120 --------+------------------------------------------------------------- |Pooled Probit Model AGE| -.00846*** .00081 -10.429 .0000 -.63399 EDUC| .03219*** .00336 9.594 .0000 .59568 HHNINC| .16699*** .04253 3.927 .0001 .09865 |Marginal effect for dummy variable is P|1 - P|0. MARRIED| .02414 .01877 1.286 .1986 .03451 |Marginal effect for dummy variable is P|1 - P|0. HHKIDS| .06754*** .01483 4.555 .0000 .05195 --------+-------------------------------------------------------------
Health Satisfaction Model ---------------------------------------------------------------------- Latent Class / Panel Probit Model Used mean AGE and FEMALE Dependent variable HEALTHY in class probability model Log likelihood function -3465.98697 --------+------------------------------------------------------------- Variable| Coefficient Standard Error b/St.Er. P[|Z|>z] Mean of X --------+------------------------------------------------------------- |Model parameters for latent class 1 Constant| .60050** .29187 2.057 .0396 AGE| -.02002*** .00447 -4.477 .0000 44.3352 EDUC| .10597*** .01776 5.968 .0000 10.9409 HHNINC| .06355 .20751 .306 .7594 .34930 MARRIED| .07532 .10316 .730 .4653 .84539 HHKIDS| .02632 .07082 .372 .7102 .45482 |Model parameters for latent class 2 Constant| .10508 .32937 .319 .7497 AGE| -.02499*** .00514 -4.860 .0000 44.3352 EDUC| .00945 .01826 .518 .6046 10.9409 HHNINC| .59026*** .19137 3.084 .0020 .34930 MARRIED| -.00039 .09478 -.004 .9967 .84539 HHKIDS| .20652*** .07782 2.654 .0080 .45482 |Estimated prior probabilities for class membership ONE_1| 1.43661*** .53679 2.676 .0074 (.56519) AGEBAR_1| -.01897* .01140 -1.664 .0960 FEMALE_1| -.78809*** .15995 -4.927 .0000 ONE_2| .000 ......(Fixed Parameter)...... (.43481) AGEBAR_2| .000 ......(Fixed Parameter)...... FEMALE_2| .000 ......(Fixed Parameter)...... --------+-------------------------------------------------------------
Zero Inflation – ZIP Models Two regimes: (Recreation site visits) Zero (with probability 1). (Never visit site) Poisson with Pr(0) = exp[- ’xi]. (Number of visits, including zero visits this season.) Unconditional: Pr[0] = P(regime 0) + P(regime 1)*Pr[0|regime 1] Pr[j | j >0] = P(regime 1)*Pr[j|regime 1] This is a “latent class model”
Hurdle Models Two decisions: Whether or not to participate: y=0 or +. If participate, how much. y|y>0 One ‘regime’ – individual always makes both decisions. Implies different models for zeros and positive values Prob(0) = 1 – F(′z), Prob(+) = F(′z) Prob(y|+) = P(y)/[1 – P(0)]
A Latent Class Hurdle NB2 Model • Analysis of ECHP panel data (1994-2001) • Two class Latent Class Model • Typical in health economics applications • Hurdle model for physician visits • Poisson hurdle for participation and negative binomial intensity given participation • Contrast to a negative binomial model
Heckman and Singer’s RE Model • Random Effects Model • Random Constants with Discrete Distribution
Heckman/Singer vs. REM ----------------------------------------------------------------------------- Random Effects Binary Probit Model Sample is 7 pds and 887 individuals. --------+-------------------------------------------------------------------- | Standard Prob. 95% Confidence HEALTHY| Coefficient Error z |z|>Z* Interval --------+-------------------------------------------------------------------- Constant| .33609 .29252 1.15 .2506 -.23723 .90941 (Other coefficients omitted) Rho| .52565*** .02025 25.96 .0000 .48596 .56534 --------+-------------------------------------------------------------------- Rho = 2/(1+s2) so 2 = rho/(1-rho) = 1.10814. Mean = .33609, Variance = 1.10814 For Heckman and Singer model, 3 points a1,a2,a3 = 1.82601, .50135, -.75636 3 probabilities p1,p2,p3 = .31094, .45267, .23639 Mean = .61593 variance = .90642
Modeling Obesity with a Latent Class Model Mark HarrisDepartment of Economics, Curtin University Bruce HollingsworthDepartment of Economics, Lancaster University William GreeneStern School of Business, New York University Pushkar Maitra Department of Economics, Monash University
Two Latent Classes: Approximately Half of European Individuals
An Ordered Probit Approach A Latent Regression Model for “True BMI” BMI* = ′x + , ~ N[0,σ2], σ2 = 1 “True BMI” = a proxy for weight is unobserved Observation Mechanism for Weight Type WT = 0 if BMI* < 0 Normal 1 if 0 < BMI* < Overweight 2 if < BMI* Obese
Latent Class Modeling • Several ‘types’ or ‘classes. Obesity be due to genetic reasons (the FTO gene) or lifestyle factors • Distinct sets of individuals may have differing reactions to various policy tools and/or characteristics • The observer does not know from the data which class an individual is in. • Suggests a latent class approach for health outcomes(Deb and Trivedi, 2002, and Bagod’Uva, 2005)
Latent Class Application • Two class model (considering FTO gene): • More classes make class interpretations much more difficult • Parametric models proliferate parameters • Two classes allow us to correlate the unobservables driving class membership and observed weight outcomes. • Theory for more than two classes not yet developed.
Correlation of Unobservables in Class Membership and BMI Equations
Outcome Probabilities • Class 0 dominated by normal and overweight probabilities ‘normal weight’ class • Class 1 dominated by probabilities at top end of the scale ‘non-normal weight’ • Unobservables for weight class membership, negatively correlated with those determining weight levels:
Inflated Responses in Self-Assessed Health Mark Harris Department of Economics, Curtin University Bruce Hollingsworth Department of Economics, Lancaster University William Greene Stern School of Business, New York University