Understanding Probability Density Functions: Normal, Lognormal, Poisson, Weibull, and Binomial
60 likes | 203 Vues
This guide explores various probability density functions (PDFs), including Normal, Lognormal, Poisson, Weibull, and Binomial distributions. Each distribution is illustrated with real-world examples, such as human heights, raindrop sizes, and coin tosses. We also delve into the concept of the Normal Distribution, detailing the role of true means and variances. Through in-class problems and software utilization (e.g., LabVIEW), learners can grasp the practical applications of these distributions in calculating probabilities, enhancing their understanding of statistical concepts.

Understanding Probability Density Functions: Normal, Lognormal, Poisson, Weibull, and Binomial
E N D
Presentation Transcript
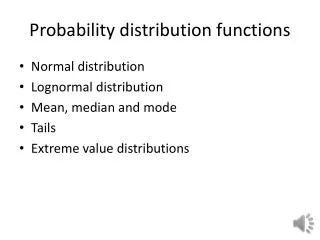
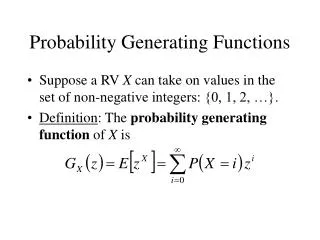
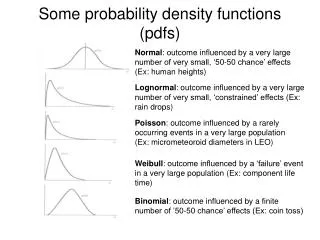
Some probability density functions (pdfs) Normal: outcome influenced by a very large number of very small, ‘50-50 chance’ effects (Ex: human heights) Lognormal: outcome influenced by a very large number of very small, ‘constrained’ effects (Ex: rain drops) Poisson: outcome influenced by a rarely occurring events in a very large population (Ex: micrometeoroid diameters in LEO) Weibull: outcome influenced by a ‘failure’ event in a very large population (Ex: component life time) Binomial: outcome influenced by a finite number of ’50-50 chance’ effects (Ex: coin toss)
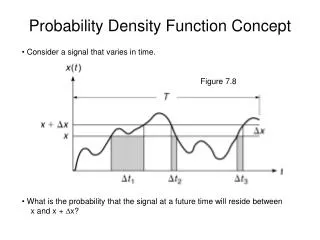
Experiment with many, small, uncontrolled extraneous variables Concept of the Normal Distribution Figure 8.5 Population, with true mean and true variance x‘ and σ
β = (x-x') / σ standardized normal variable z1 = (x1-x') / σ normalized z-variable (z1 is a specific value of β); subscript 1 usually dropped where p(z1) is the normal error function. Normalized Variables
In-Class Problem • What is the probability that a student will score between 75 and 90 on an exam, assuming that the scores are distributed normally with a mean of 60 and a standard deviation of 15 ?
0.3413 0.9544 0.9974 Table 8.2 Normal Error Function Table Pr[0≤z≤1] = 0.6826 Pr[-1≤z≤1] = Pr[-2≤z≤2] = Pr[-3≤z≤3] = Pr[-0.44≤z≤4.06] =
Statistics Using LabVIEW • Another name for the probability distribution function (PDF) is the cumulative distribution function (CDF or cdf). Why is it called cumulative? • Here is where you can find CDF functions and the inverses of these functions in LabVIEW • Let’s solve the previous problem using LabVIEW