Download
1 / 27
270 likes | 307 Vues
Explore Riemannian clustering and nonlinear dimensionality reduction for probability density functions, overcoming challenges of non-parametric nature and infinite dimensions. Global and local techniques applied for accurate similarity mapping. Learn about Riemannian analysis of PDFs, extending NLDR to manifolds, calculating M for LLE, LE, and HLLE, and local Riemannian manifold clustering. Conduct synthetic experiments and texture clustering for practical applications.

E N D
Unsupervised Riemannian Clustering of Probability Density Functions Alvina Goh and René Vidal Department of Biomedical Engineering Center for Imaging Science Johns Hopkins University
Introduction • Data clustering and dimensionality reduction is an important topic having applications in various areas. • In our work, every data point is not just a point, but a probability density function (pdf). • Therefore, the question is how to do clustering and dimensionality reduction of pdfs. ?
Motivation • Texture is a function of the spatial variation in pixel intensities. By convoluting an image with a set of filters, it is possible to generate a histogram representing the patterns present. • Modern object recognition techniques use similar ideas; categories are represented with histograms of codewords. • In high angular resolution diffusion imaging, the data at each voxel is the orientation distribution function.
Challenges • How do we develop a computationally simple framework that allows us to group the pdfs into similar families? • These pdfs are determined from data and they are non-parametric in nature. • These are infinitely dimensional objects. In order to compare them and cluster them, we need a metric in the space. • This is a clustering problem in the statistical manifold of pdfs.
Main Contributions To develop Riemannian clustering and nonlinear dimensionality reduction for pdfs, that proceeds by making use of the square-root representation and the resulting Riemannian geometry, generalized LLE, LE, HLLE with Riemannian metric, generating a mapping from different submanifolds to different central clusters.
Global techniques Preserve global properties of the data lying on a sub-manifold. Similar to PCA for a linear subspace. Isomap, Kernel PCA. Local techniques Preserve local properties obtained from small neighborhoods around points. Also retain the global properties of the data via spectral analysis. Locally Linear Embedding (LLE) (Roweis, Saul 03), Laplacian Eigenmaps (LE) (Belkin, Niyogi 02), Hessian LLE (Donoho, Grimes 03) Nonlinear dimensionality reduction
Riemannian Analysis of Probability Density Functions • Class of constrained non-negative continuous functions • The Fisher-Rao metric is the unique intrinsic metric • where are tangent vectors and is the set containing the function tangent to at the point . • Difficult to work with as ensuring the geodesic between two elements lie on is not easy.
Riemannian Analysis of Probability Density Functions • Square-root representation The functions lie on a unit sphere. • The Fisher-Rao metric is then • are tangent vectors • Closed form formulae for • geodesic distance • exponential map • logarithm map
Extending NLDR to Riemannian manifolds • Manifold geometry essential only in first two steps of each algorithm. • How to select the kNN? • by incorporating the Riemannian distance • How to compute the matrix representing the local geometry?
Riemannian Calculation of M for LLE • LLE involves writing each data point as a linear combination of its neighbors. • Riemannian case: interpolation problem on the manifold. • How should the data points be interpolated? • What cost function should be minimized? • as in the Euclidean case.
Riemannian Calculation of M for LE and HLLE • Extending LE is straightforward and involves replacing the Euclidean metric by the Riemannian metric. • Construct the weight matrix as • We have where as before. • HLLE involves finding the mean and the tangent space at each point. • The mean at on the manifold is the Frechet mean of its k-NN . found as the solution to • The basis for is found via an eigenanalysis of the covariance matrix using Principal Geodesic Analysis (Fletcher and Joshi 04).
Local Riemannian Manifold Clustering Let be a set of points drawn from a k-disconnected union of k-connected submanifolds with dimensions of a Riemannian manifold . When the assumption of separated submanifolds is violated, we have and , respectively. Applying K-means to gives the clustering of the data.
Unsupervised Clustering of PDFs • Making use of the closed-form formula under the square-root representation and the algorithm for local Riemannian manifold clustering, we can perform unsupervised clustering of pdfs.
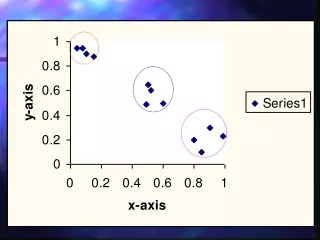
Synthetic Experiments Applying Riemannian LLE to two groups of uniform pdfs Clustering two groups of pdfs
Texture Clustering In order to construct a histogram that reflects the texture statistics in an image, we will calculate textons. This is done by first applying a filter bank to all images in the training set. Filters used to generate the histogram of texture This will provide us with a feature vector of dimension 13 at each pixel. Next, we apply k-means to all the vectors in the entire dataset to get 30 cluster centers. For each image, compute a histogram that contains the number of pixels corresponding to each one of these 30 bins.
Conclusion • Presented an algorithm for grouping families of probability density functions. • Exploit the fact that under the square root re-parametrization, the space of pdfs form a convex subset of the unit Hilbert sphere. • The problem of clustering pdfs reduces to clustering multiple submanifolds on the unit Hilbert sphere. • Results on synthetic and real data are encouraging.
Acknowledgments • Funding from • Startup funds from JHU, • NSF CAREER IIS-0447739, • NSF EHS-0509101, • ONR N00014-05-10836, • JHU APL-934652. • The authors thank Rizwan Chaudhry for useful discussions. Vision, Dynamics and Learning Lab @ Johns Hopkins University Thank You!