Download
1 / 1
10 likes | 125 Vues
-1. -1. -1. +1. +1. +1. Wave

E N D
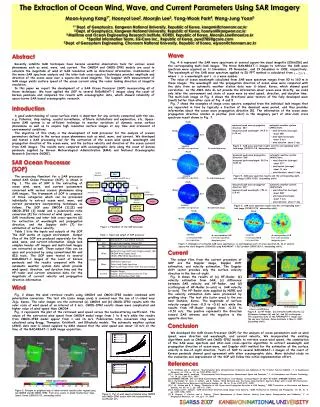
-1 -1 -1 +1 +1 +1 Wave Fig. 4-6 represent the SAR wave spectrums at several square-km sized imagette (256x256) and the corresponding multi-look images. The three RADARSAT-1 images to retrieve the SAR wave spectrum were acquired on 11 November, 25 November, and 19 December in 1999, respectively. The wavelength of the SAR wave spectrum applied to 2D FFT method is calculated from , where is a wavelength and is a wave number. The value of ocean wavelength calculated from SAR wave spectrum ranges from 90 to 160 m in these images. The wavelength and the propagation direction of ocean wave were compared with the data from an automatic weather station data near U-island, Korea, which showed good correlation. As the AWS data do not provide the information about ocean wave directly, we could only infer the environment and state of ocean wave by wind speed, direction, and duration time. The multi-look image at Fig. 6 shows the directional wave texture of the fully developed wave (swell) better than other case of Fig. 4 and 5. Fig. 7 shows the examples of image cross spectra computed from the individual look images that are separated in time by typically a fraction of the dominant wave period, and thus provides information about the ocean wave propagation direction [5]. The information of the ocean wave propagation direction resides in positive (red color) in the imaginary part of inter-look cross spectrum result shown in Fig. 7. North Range East Azimuth (b) multi-look image (a) SAR wave spectrum North Range East Az FFT (Imagette) SLC Az FFT, Beam Split, Az iFFT, Detect Doppler Shift Azimuth l1 l2 l3 l4 (a) SAR wave spectrum (b) multi-look image Avg 2D-FFT (Imagette) 2D-FFT (Imagette) 2D-FFT (Imagette) 2D-FFT (Imagette) North CMOD CMOD-IFR2 Shift Detection L1L3* L2L4* Multi-Look (4 Looks) Range Cross Spectrum Cross Spectrum Surface Velocity 2D FFT (Imagette) Wind East Avg SAR Wave Spectrum Inter-Look Cross Spectra Azimuth (a) SAR wave spectrum (b) multi-look image Ocean Wave Spectrum Solve 180° Ambiguity North North Figure 1. Flowchart of the SOP processor Range Range East East Azimuth Azimuth (d) corresponding SAR wave cross spectrum (imaginary part) (b) corresponding SAR wave cross spectrum (imaginary part) (c) extracted SAR wave spectrum (a) extracted SAR wave spectrum Figure 7. Examples of extracted SAR wave spectrum (a, c) and imaginary part of cross spectrum (b, d) at several square-km sized imagette (128x128) using RADARSAT-1 SLC product (1999/12/19, descending orbit). (a) HF-Radar (b) SAR velocity (c) Difference between SAR velocity and HF-Radar (d) Scattergram Figure 8. (a) HF-Radar, (b) extracted SAR velocity, (c) Difference between (b) and (a), and (d) scattergram. The acquisition date of this RADARSAT-1 image over the sea near Incheon, Korea peninsula is May 6, 2003 (ascending orbit). Figure 2. Example of graphical map of wind retrieval results (color region) using (a) CMOD4 and (b) CMOD-IFR2. Test area covers U-island located near Jeju-island, Korea (1999/11/15, descending orbit). Figure 3. Plot of wind speed estimated using CMOD4 and CMOD-IFR2 models with the backscattering coefficient (σ0). The Extraction of Ocean Wind, Wave, and Current Parameters Using SAR Imagery Moon-kyung Kang1*, Hoonyol Lee2, Moonjin Lee3, Yong-Wook Park4, Wang-Jung Yoon5 1* Dept. of Geophysics, Kangwon National University, Republic of Korea, kangmk@chonnam.ac.kr 2 Dept. of Geophysics, Kangwon National University, Republic of Korea, hoonyol@kangwon.ac.kr 3 Maritime and Ocean Engineering Research Institute, KORDI, Republic of Korea, Moonjin.Lee@moeri.re.kr 4 Spatial Information Team, 3G-Core Inc., Republic of Korea, pyw2785@gcore.com 5 Dept. of Geosystem Engineering, Chonnam National University, Republic of Korea, wjyoon@chonnam.ac.kr Abstract Recently satellite SAR techniques have become essential observation tools for various ocean phenomena such as wind, wave, and current. The CMOD4 and CMOD-IFR2 models are used to calculate the magnitude of wind at SAR resolution with no directional information. Combination of the wave-SAR spectrum analysis and the inter-look cross-spectra techniques provides amplitude and direction of the ocean wave over a square-km sized imagette. The Doppler shift measurement of SAR image yields surface speed of the ocean current along the radar looking direction at imagette resolution. In this paper we report the development of a SAR Ocean Processor (SOP) incorporating all of these techniques. We have applied the SOP to several RADARSAT-1 images along the coast of Korean peninsula and compared the results with oceanographic data, which showed reliability of space-borne SAR based oceanographic research. Introduction A good understanding of ocean surface state is important for any activity connected with the sea, e.g. fisheries, ship routing, coastal surveillance, offshore installations and exploration, etc. Space-borne SAR system is an efficient technique to monitor variations of dynamic ocean surface phenomena as well as to acquire high resolution surface images at any time and irrelevant of environmental conditions. The objective of this study is the development of SAR processor for the analysis of oceanic parameters defined in the various ocean phenomena such as wind, wave, and current. We developed and tested a SAR processing tool for the extraction of the ocean wind speed, wavelength and propagation direction of the ocean wave, and the surface velocity and direction of the ocean current from SAR images. The results were compared with oceanographic data along the coast of Korean peninsula supplied by Korean Meteorological Administration (KMA) and National Oceanographic Research Institute (NORI). Figure 4. SAR wave spectrum results and the corresponding multi-look image (1999/11/15, descending orbit). SAR Ocean Processor (SOP) The processing flowchart for a SAR processor named SAR Ocean Processor (SOP), is shown in Fig. 1. The aim of SOP is the extracting of ocean wind, wave, and current parameters concerned with various oceanic phenomena using SAR images. The framework of SOP is composed of three categories which can be processed individually to extract ocean wind, wave, and current parameters incorporating techniques as follows. The SOP uses CMOD4 [1],[2] and CMOD-IFR2 [3] model and a polarization ratio conversion [4] for retrieval of wind speed, wave-SAR transforms and inter-look cross-spectra [6] for extraction of wavelength and propagation direction, and the Doppler shift [7] for estimation of surface velocity. Table 1 lists the inputs and outputs of the SOP. The SOP works at cygwin environment. Output files of the SOP are produced separately for the wind, wave, and current information. Single-look complex header off images and multi-look images are extracted as well. These output files can be open and processed by using conventional RS and GIS tools. The SOP were tested to several RADARSAT-1 images of the coast of Korean peninsula and the results compared with the automatic weather system data which provide wind speed, direction, and duration time and the HF-radar and current simulation data for the magnitude of current velocity and propagation direction information. Figure 5. SAR wave spectrum results and the corresponding multi-look image (1999/11/25, descending orbit). Figure 6. SAR wave spectrum results and the corresponding multi-look image (1999/12/19, descending orbit). Table 1. Input and output of SOP processor Current The output files from the current procedure of SOP are the Doppler image, Doppler shift estimation, and velocity estimation. The Doppler shift vector provides only the surface velocity direction in the line-of-sight. Fig. 8 shows the results of (a) HF-Radar, (b) velocity estimation from SAR, (c) difference between SAR velocity and HF-Radar, and (d) scattergram of HF-Radar (x-axis) vs. SAR velocity (y-axis). The HF-Radar data supplied by NORI and the velocity estimation data were processed by gridding step. The test site (color area) is the sea near Incheon, Korea. The magnitude of surface velocity ranged from -0.5 to +0.61 m/s while the results from HF-Radar ranged from -0.33 to +0.51 m/s. The positive represents the direction toward SAR antenna and the negative is the opposite direction. Wind Fig. 2 shows the wind retrieval results using CMOD4 and CMOD-IFR2 models combined with polarization conversion. The test site (color image area) is covered near the sea of U-island near Jeju, Korea. The color images are the extracted (a) CMOD4 and (b) CMOD-IFR2 results with the color scale of wind speed at an interval of 2 m/s. CMOD-IFR2 results shown more complicated and higher value of wind speed than CMOD4. Fig. 3 represents the plot of the retrieved wind speed versus the backscattering coefficient. The values of the extracted wind speed from CMOD4 model range from 1 to 8 m/s while the results from CMOD-IFR2 model appear from 1 and 16 m/s. Polarization ratio conversion step were calculated using Bragg, Thompson, Krichhoff, and Elfouhaily models. The automatic weather system (AWS) data near U-island supplied by KMA showed that the wind speed was about 10 m/s at the time of the RADARSAT-1 SAR image acquisition. Conclusion We developed the SAR Ocean Processor (SOP) for the analysis of ocean parameters such as wind speed, wave direction and wavelength, and current velocity. We incorporated the existing algorithms such as CMOD4 and CMOD-IFR2 models to retrieve ocean wind speed, the combination of the SAR wave spectrum and inter-look cross-spectra algorithms to extract wavelength and propagation direction of ocean wave, and Doppler shift method for the estimation of the surface velocity in line-of-sight direction. Tests of SOP to several RADARSAT-1 images of the coast of Korean peninsula showed good agreement with other oceanographic data. More detailed study on the evaluation and improvement of the SOP will follow this initial implementation effort. References [1] A. Stoffelen and D. Anderson, “Scatterometer Data Interpretation: Estimation and Validation of the Transfer Function CMOD4,” J. of Geophysical Research, vol. 102, no. C3, pp. 5767-5780, 1997. [2] A. Stoffelen and D. Anderson, “Scatterometer Data Interpretation: Measurement Space and Inversion,” J. of Atmospheric and Oceanic Technology, vol. 14, pp. 1298-1313, 1997. [3] IFREMER-CERSAR: Off-Line Wind Scatterometer ERS Products: User Manual, Technical Report C2-MUT-W-010IF, IFREMER-CERSAR, 1999. [4] J. Horstmann, W. Koch, S. Lehner, and R. Tonboe, “Wind Retrieval over the Ocean using Synthetic Aperture Radar with C-band HH Polarization,” IEEE Transaction on Geoscience and Remote Sensing, vol. 38, no. 5, pp. 2122-2131, 2000. [5] P. W. Vachon and R. K. Raney, “Resolution of the Ocean wave Propagation Direction in SAR Imagery,” IEEE Transaction on Geoscience and Remote Sensing, vol. 29, no. 1, pp. 105-112, 1991. [6] G. Engen and H. Johnsen, “SAR-Ocean Wave Inversion Using Image Cross Spectra,” IEEE Transaction on Antennas and Propagation, vol. 33, no. 4, pp. 1047-1056, 1995. [7] B. Chapron, C. Fabrice, and A. Fabrice, “Direct Measurments of Ocean Surface Velocity from Space: Interpretation and Validation,” J. of Geophysical Research, vol. 110, pp.1-17, 2005. IGARSS2007KANGWONNATIONALUNIVERSITY


![[TIDAL WAVE AND OCEAN CURRENT ENERGY PRODUCTION]](https://cdn1.slideserve.com/1590527/tidal-wave-and-ocean-current-energy-production-dt.jpg)