Download
1 / 61
620 likes | 887 Vues
Pasta, Low Glycemic Index Diets and Health. Dr. Cyril W.C. Kendall Department of Nutritional Sciences, Faculty of Medicine, University of Toronto; The Clinical Nutrition & Risk Factor Modification Center, St. Michael’s Hospital; Toronto, Ontario CANADA. Weight Loss & Dieting.

E N D
Pasta, Low Glycemic Index Diets and Health Dr. Cyril W.C. Kendall Department of Nutritional Sciences, Faculty of Medicine, University of Toronto; The Clinical Nutrition & Risk Factor Modification Center, St. Michael’s Hospital; Toronto, Ontario CANADA
Weight Loss & Dieting • 45% of women and 30% of men are • trying to lose weight (US data).
Desire for Healthy Eating • What parents want for their children: • 99% of parents agreed that “it is important for my child to eat nutritious foods”; • 91% believed that it’s important to “restrict the amount of sugars consumed”; and • 84% believed “dietary fat reduction was important” Christine Wood, M.D. How to Get Kids to Eat Great & Love It
Obesity Trends* Among U.S. AdultsBRFSS, 1985 Source: Mokdad A H, et al. J Am Med Assoc1999;282:16, 2001;286:10.
Obesity Trends* Among U.S. AdultsBRFSS, 1986 Source: Mokdad A H, et al. J Am Med Assoc1999;282:16, 2001;286:10.
Obesity Trends* Among U.S. AdultsBRFSS, 1987 Source: Mokdad A H, et al. J Am Med Assoc1999;282:16, 2001;286:10.
Obesity Trends* Among U.S. AdultsBRFSS, 1988 Source: Mokdad A H, et al. J Am Med Assoc1999;282:16, 2001;286:10.
Obesity Trends* Among U.S. AdultsBRFSS, 1989 Source: Mokdad A H, et al. J Am Med Assoc1999;282:16, 2001;286:10.
Obesity Trends* Among U.S. AdultsBRFSS, 1990 Source: Mokdad A H, et al. J Am Med Assoc1999;282:16, 2001;286:10.
Obesity Trends* Among U.S. AdultsBRFSS, 1991 Source: Mokdad A H, et al. J Am Med Assoc1999;282:16, 2001;286:10.
Obesity Trends* Among U.S. AdultsBRFSS, 1992 Source: Mokdad A H, et al. J Am Med Assoc1999;282:16, 2001;286:10.
Obesity Trends* Among U.S. AdultsBRFSS, 1993 Source: Mokdad A H, et al. J Am Med Assoc1999;282:16, 2001;286:10.
Obesity Trends* Among U.S. AdultsBRFSS, 1994 Source: Mokdad A H, et al. J Am Med Assoc1999;282:16, 2001;286:10.
Obesity Trends* Among U.S. AdultsBRFSS, 1995 Source: Mokdad A H, et al. J Am Med Assoc1999;282:16, 2001;286:10.
Obesity Trends* Among U.S. AdultsBRFSS, 1996 Source: Mokdad A H, et al. J Am Med Assoc1999;282:16, 2001;286:10.
Obesity Trends* Among U.S. AdultsBRFSS, 1997 Source: Mokdad A H, et al. J Am Med Assoc1999;282:16, 2001;286:10.
Obesity Trends* Among U.S. AdultsBRFSS, 1998 Source: Mokdad A H, et al. J Am Med Assoc1999;282:16, 2001;286:10.
Obesity Trends* Among U.S. AdultsBRFSS, 1999 Source: Mokdad A H, et al. J Am Med Assoc1999;282:16, 2001;286:10.
Obesity Trends* Among U.S. AdultsBRFSS, 2000 Source: Mokdad A H, et al. J Am Med Assoc1999;282:16, 2001;286:10.
Obesity Trends* Among U.S. AdultsBRFSS, 2001 Source: Mokdad A H, et al. J Am Med Assoc1999;282:16, 2001;286:10.
Childhood Overweight and Obesity: International Statistics • (Ebbeling et al, Lancet, 2002)
Health Consequences of Obesity (Ebbeling et al. Lancet, 2002)
Weight Loss – 6 Months * * *
The Perfect Storm Against Carbohydrates ● Increasing obesity rates. ● Increases in % carbohydrate dietary intakes. ● Some scientific evidence indicating low carbohydrate diets are more effective for promoting weight loss.
Changing the Tide for Carbohydrates ● Oldways Pasta Meeting (Rome, Feb 2004). Bringing experts together to discuss the issue and promote the healthy carbohydrate message. ● Individuals on Atkins diet suffering CHD events and suing. ● New scientific evidence.
Daily Caloric Food Consumption Modified from Table 1 p. 15 Diet, Nutrition, and the Prevention of Chronic Disease, WHO Technical Report 916, 1-160, 2003 , increases in sugar and fat intake
Weight loss on Low-carbohydrate diet Base-line Values Carried Forward Conventional diet Low-carbohydrate diet Low compliance on both diets. Foster GD et al. N Engl J Med. 2003;348:2082-90.
Percent change in LDL-C Foster GD et al. N Engl J Med. 2003;348:2082-90.
Tufts Popular Diet Study Dansiger, Gleason, Wen, Griffin, Selker, Schaefer JAMA 2005;293:43-53
Tufts Popular Diet Study Compliance at 12 months: 21/40 still on Atkins (A), 20/40 on Ornish (O), 26/40 on Weight Watchers (WW), 26/40 on Zone (Z). Dansiger, Gleason, Wen, Griffin, Selker, Schaefer JAMA 2005;293:43-53
Diabetes and Gestational Diabetes Trends Among Adults in the U.S., BRFSS 1990, 1995 and 2001 1990 1995 2001 No Data <4% 4%-6% 6%-8% 8%-10% >10% Mokdad AH, Ford ES, Bowman BA, et al. Prevalence of obesity, diabetes, and other obesity-related health risk factors, 2001. JAMA 2003 Jan 1;289(1).
Diabetes Prevention Program Study • Metformin vs. Lifestyle (exercise & diet) 31 % 58 % Diabetes Complications 2.1 Kg 5.6 Kg Weight Loss Diabetes Prevention Program Research Group. N Engl J Med 2002;346:393.
STOP-NIDDM Trial N= 1,386 subjects with Impaired Glucose Tolerance (high risk of developing diabetes) ~50% of subjects received acarbose (α-glucosidase inhibitor, ↓ rate of glucose absorption). RESULT: ↓ 36% progression to diabetes Chiasson J-L, Josse RG, Hanefeld M, et al. JAMA 2003;346:393.
STOP-NIDDM Trial CVD Events Acarbose ↓ 49% RR Chiasson J-L, Josse RG, Hanefeld M, et al. JAMA 2003;346:393.
STOP-NIDDM Trial Hypertension (new cases) Acarbose ↓ 34% RR Chiasson J-L, Josse RG, Hanefeld M, et al. JAMA 2003;346:393.
Glycemic Index Low vs. High GI Foods:
Foods grouped into high, intermediate and low classes according to GI : High GI • High GI (GI >90) • Most Breads • Plain Crackers • Most Breakfast Cereals • Instant Mashed Potatoes • Millet • Corn chips • Buckwheat • Sweet Corn • Boiled New Potatoes • Yam • Sweet Potatoes • Medium GI (GI 70-89) • All Bran • Oatmeal • Most biscuits or cookies • Rice Intermediate GI • Low GI (GI <69) • Pasta • Pumpernickel Bread • Parboiled Rice • Most legumes (dried) • Nuts • Barley • Bulgur (cracked wheat) Low GI GLYCEMIC INDEX RANKING
Mixed meals are predictablein subjects with type 2 diabetes GI Bornet et al. Am J Clin Nutr 1987, 42:1192
Postprandial Metabolism and Oxidative Stress Ciriello, 2003
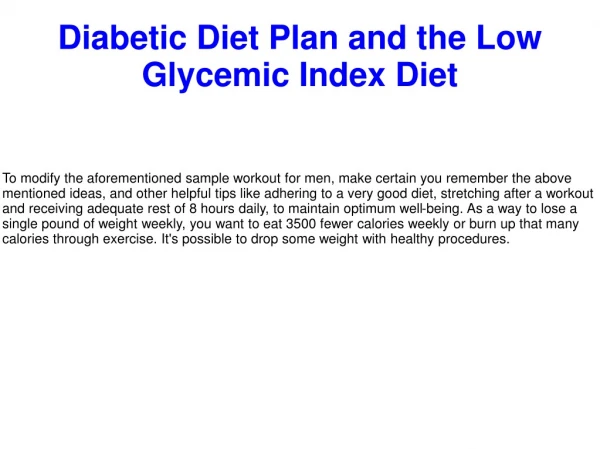
Metabolism of Carbohydrates “With regard to the glycemic effects of carbohydrates, the total amount of carbohydrate in meals or snacks is more important than the source or type” American Diabetes Association, (Diabetes Care Jan 2004;27:37s).
Metabolism of Carbohydrates ●“Regulation of blood glucose to achieve near normal levels is a primary goal in the management of diabetes, and, thus, the dietary techniques that limit hyperglycemia following a meal are likely important in limiting the complications of diabetes.” ●“A recent analysis of the randomized controlled trials that have examined the efficacy of the glycemic index on overall blood glucose control indicates that the use of this technique can provide an additional benefit over that observed when total carbohydrate is considered alone.” American Diabetes Association, (Diabetes Care Sept 2004;27:2267).
Low vs High GI Diet: a Meta-Analysis% Difference in Glycated Proteins % -35 -25 -15 -5 5 15 Gilbertson et al. 2001 Komindr et al. 2001 Giacco et al 2000 Luscombe et al 1999 Jarvi et al 1999 Lafrance et al 1998 Frost et al 1993 Wolever et al 1992 Wolever et al 1992 Fontvieille et al 1992 Brand et al 1991 Jenkins et al 1991 Fontvieille et al 1988 Collier et al 1988 OVERALL RESULT Mean %difference in 14 studies = -7.4% (CI -8.8 to -6.0%) Brand-Miller et al, Diabetes Care 2003;26:2261-67
Glycemic load and risk of diabetesNurses Health Study 6 years of follow-up in 65,000 women Relative risk of Type 2 Diabetes P < 0.03 adjusted for known risk factors Glycemic load Salmeron et al. JAMA 1997;277:472-7
Glycemic load and risk of heart attackNurses Health Study 10 years of follow-up in 65,000 women P < 0.0001 adjusted for known risk factors Relative risk of CHD Lowest Glycemic load Highest Liu et al. Am J Clin Nutr 2000,71: 1455
Glycemic index and HDL-cholesterol Frost et al. Lancet 1999;353:1045-8