Download
1 / 30
300 likes | 398 Vues
This research aims to identify critical circulation patterns associated with extreme events using objective classification systems in observational and RCM generated data. The study focuses on achieving homogeneity in classifying patterns and explains precipitation variability. The methodology involves fuzzy rule-based classification and optimization of classification to differentiate patterns. Data from observational and RCM sources for the German part of Rhein Basin are analyzed for precipitation indices and wetness indices to determine critical patterns. The research compares observational and RCM data, with future plans to identify critical patterns related to droughts through geopotential heights.

E N D
Identification of Critical Circulation Patterns in observational and RCM generated Data M.Mahboob Alam,András Bardossy DeBilt-15th May 2008 Institute of Hydraulics Univ. Stuttgart,Germany
Contents • Objectives • Introduction of the Classification system • Data • Results • Future Plans
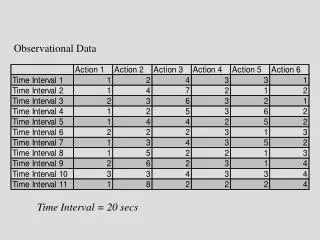
Objectives • Identification of Critical Circulation patterns associated with extreme events through objective classification of Circulation types (WP5.4 b) • Validation of Extreme Events and assessment of changes of extreme events in RCM generated data (WP5.4 d)
Methodology • Objective Classification • Fuzzy rule based classification system (Bárdossy,1995) • Objective Function • Optimal classification • Each class as homogenous as possible • Difference between the classes as big as possible
Objective Function • Achieve set of CPs which exaplain variability of Precipitation (ppt.) • Two Objective Functions are used • Dealing with Probability of ppt. • Dealing with the amount of ppt.
Objective Function....Contd. • Both the Objective Function are combined by taking a weighted sum
Wetness Index WI(-) • Is a measure of Wetness in a given classification • Ratio of % of annual precipitation total and precipitation total for a given CP And Occurance frequency of CP • Higher WI -> wetter CP • contribution of precipitation increase for a given CP and its occurance frequency
Data • RT5 generated gridded observational data • RT2B generated RCM data • NCEP data • Time period • Observational data-1950-2000 • RCM data-1958-2000 (ERA40 driven) • RCM data-1958-2050 (ECHAM5 driven) • Data Resolution • 50km,25km,0.5°,0.25°
Area of Investigation • German part of Rhein Basin • Tot. Area of basin= 185,000 Km2 • Area of German part=100,000Km2
Identified Critical CP‘s • RT5-Gridded observational data set • Time period 1950-2000 • Based on RT5‘s best estimate data on 0.5° resolution for Rhein Basin • Daily mean precipitation data at 83 grid points being considered as station data • 12 CP‘s are classified
Driest CP • WI=0.36
Precipitation Indices • Pav Mean Precipitation • Pqnn nnth percentile of rainday amounts
Precipitation Indices RT5 observational Data • Pn10mm No. Of days >= 10mm • Pxcdd Max. No. Of Consecutive dry days • Pxcwd Max. No. Of Consecutive wet days
Precipitation Indices RT5 observational Data • Px3d Greatest 3-day total rainfall • Px5d Greatest 5-day total rainfall
RCM Generated Data • KNMI‘s Generated RCM data based on ERA40 Reanalysis is used • Optimized CP definition from Obeservational data is used for classification of CP‘s
Wet CPs • WI=2.27 • WI=1.86
Precipitation Indices RT2B-ERA40 • Pav Mean Precipitation • Pqnn nnth percentile of rainday amounts
Precipitation Indices RT2B-ERA40 • Pn10mm No. Of days >= 10mm • Pxcdd Max. No. Of Consecutive dry days • Pxcwd Max. No. Of Consecutive wet days
Precipitation Indices RT2B-ERA40 • Px3d Greatest 3-day total rainfall • Px5d Greatest 5-day total rainfall
Near Future Plans • CP identification through geopotential heights at different pressure levels • Comparison of observational gridded data with other RCM‘s generated data • Identification of critical circulation patterns related with droughts • Subclassification of identified critical CP‘s