Chapter 9: Supply
Chapter 9: Supply. Essential Question. How do suppliers decide what goods and services to offer?. Chapter 9: Supply Section 1. Objectives. Explain the law of supply. Interpret a supply schedule and a supply graph. Examine the relationship between elasticity of supply and time.

Chapter 9: Supply
E N D
Presentation Transcript
Essential Question • How do suppliers decide what goods and services to offer?
Objectives • Explain the law of supply. • Interpret a supply schedule and a supply graph. • Examine the relationship between elasticity of supply and time.
The Law of Supply • Supply is the amount of goods available. • Law of supply: as the price of a good increases, producers will offer more of it and as the price decreases, they will offer less. • The law of supply includes two movements: • Individual firms changing their level of production • Firms entering or exiting the market
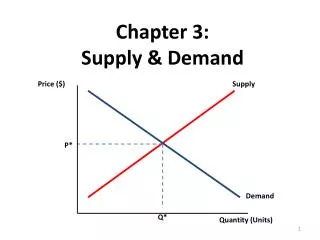
What is the Law of Supply? The law of supply states that as price rises, the quantity supplied rises; when price decreases, quantity supplied decreases.
What is Quantity Supplied? • Quantity supplied is the amount a producer (supplier) is willing and able to supply at a set price. vs.
If a firm is earning a profit from the sale of a good or service, then an increase in the price will, in turn, increase the firm’s profits. In general, the search for profit drives the choices made by the producer. Why Do Firms Produce More When Prices Rise?
Market Entry • Rising prices encourage new firms to join the market and will add to the quantity supplied of the good. • Take, for example, the music market: • When a particular type of music becomes popular, such as 70’s disco or 90’s grunge, more bands will play that type of music in order to profit from such music’s popularity. • This action reflects the law of supply.
The Supply Schedule • Supply of a good can be measured using a supply schedule. • An individual supply schedule shows how much of a good a single supplier will be able to offer at various prices. • A market supply schedule shows how much of a good all firms in a particular market can offer at various prices.
Supply Schedule • The supply schedule lists how many slice of pizza one pizzeria will offer at different prices. • What does the individual supply schedule tell you about the pizzeria owner’s decisions? • The market supply schedule represents all suppliers in a market. • How does the market supply schedule compare to the individual supply schedule?
The Supply Graph • A supply schedule can be represented graphically by plotting points on a supply curve.
Elasticity of Supply • Elasticity of supply, based on the same concept of elasticity of demand, measures how firms will respond to changes in the price of a good. • Elastic: when elasticity is greater than one, supply is very sensitive to price changes • Inelastic: when elasticity is less than one, supply is not very responsive to price changes.
In the short run, it is difficult for a firm to change its output level, so supply is inelastic. Elasticity in the Short Run • Many agricultural businesses, such as harvesting cranberries, have a hard time adjusting to price changes in the short term. • Hard to increase the supply of fruit in the short term. • Few ways to cut supply – amount of fruit will be the same regardless of the price.
Elasticity in the Long Run • In the long run, supply can become more elastic. • Just like demand, supply becomes more elastic if the supplier has a longer time to respond to a price change. • Haircuts • When prices for haircuts rise, salons & barbershops can hire workers or extend their hours. • When prices for haircuts drop, workers are laid off, hours are reduced, or stores close.
Review • How does the law of supply affect the quantity supplied? • What is the difference between supply and quantity supplied? • When the price of oil rises, what will happen to oil production in an oil-rich country? • Give examples of two variables, other than price, for each of the following markets. • A rock band concert • A bakery
Objectives • Explain how firms decide how much labor to hire in order to produce a certain level of output. • Analyze the production costs of a firm. • Explain how a firm chooses to set output. • Identify the factors that a firm must consider before shutting down a profitable business.
Introduction • When thinking about how to maximize profits, producers think about the cost involved in producing one more unit of a good. • Costs producers take into consideration are: • Operating cost • Variable cost • Total cost • Marginal cost
Labor and Output • The number of workers a firm hires affects total production. • The more workers, the more the firm can produce until a certain point.
What is Marginal Product of Labor? MP = O2 – O1 • 2nd worker = 6 bags • 4th worker = 6 bags • 7th worker = 1 bag • The marginal product of labor is the change in output from hiring one additional unit of labor.
Marginal Returns • Increasing marginal returns: a level of production in which the marginal product of labor increases as the number of workers increases. • Decreasing marginal returns: additional workers increase the Total production, but at a lower rate; marginal product of labor decreases as the number of workers increases. • Negative marginal returns: when adding additional workers actually causes production to drop.
The addition of more workers to a firm allow for a greater amount of specialization. Specialization saves time and makes the workers more efficient. As a result, production increases per worker and the firm enjoys increasing marginal returns. Marginal Returns
Marginal Returns • Eventually, though, the benefits of specialization end and the addition of more workers increases total output but at a diminishing rate. • A firm with diminishing marginal returns will produce less and less output from each additional unit of labor. What is the marginal product of labor when the factory employs five workers?
What are the Costs of Production? • Production costs are divided into two categories - fixed costs and variable costs. • Fixed costsare expenses that continue at relatively stable levels, month after month or year after year; not related to what you’re producing. • Rent • Utilities • Property taxes • Worker’s salaries • Variable costs increase or decrease according to the level of production. • Hourly Wages • Materials • Utilities http://financial-dictionary.thefreedictionary.com/fixed+expenses
Total Cost and Marginal Cost • Fixed costs and variable costs are added together to find the total cost. • Marginal cost is the extra cost of producing one more unit. • A firm’s primary goal is to maximize profits. • The firm wants to make the most profit with the least amount of total production cost to the firm. • Profit = Total Revenue – Total Cost
Marginal Cost of Production • Knowing the total cost of several levels of output helps determine the marginal cost of production at each level, or the additional costs of producing one more unit. • One way to find the best level of output is to figure out where marginal cost is equal to marginal revenue, or the additional income from selling one more unit of a good.
How Does a Firm Decide How Much to Produce? • Marginal revenue is the extra income from selling one more unit of a good. • If the firm has no control over the market price, marginal revenue equals the market price. • Profit is greatest when marginal revenue (price) equals the marginal cost. • Average cost is the total cost divided by the quantity produced. • Profit is the difference between market price and average cost multiplied by the quantity.
Setting Output P + TC TC2 – TC1 Why is the marginal revenue always equal to $24?
The graph shows how a firm’s profit per hour can be determined by subtracting total cost from total revenue. What would happen to output if market price fell to $20? Why would the firm increase output if the price of a beanbag rose to $37? Determining a Firm’s Profit
The Shutdown Decision • Sometimes, even though a factory is producing at its most profitable level, the market price is so low that the factory’s total revenue is still less than its total cost (spending more money than they’re making). • The factory owners have two choices: • Continue to produce goods and lose money • Shut down the factory (would still have to pay all fixed costs) • The firm can only stay in the market if the price is high enough to cover all the costs of production.
Option 1: Continue to Produce • The firm should keep the factory open if the total revenue from the goods is greater than the cost of keeping the factory open. • Best choice if the total revenue from the goods/services is greater than the cost of keeping it open. • Operating costs are the cost of operating the facility; includes variable costs, but not fixed costs.
If a firm shuts the factory down it still has to pay all of its fixed costs so it would have money going out but nothing coming in. Total revenue equals zero because the firm is producing nothing for sale. Option 2: Shut Down the Factory • The firm would lose an amount equal to its fixed costs.
Review • What does marginal cost refer to? • List two examples for fixed and variable costs. • What is marginal revenue? • Is operating cost a fixed or variable cost? Why
Objectives • Explain how factors such as input costs create changes in supply. • Identify three ways that the government can influence the supply of goods. • Analyze other factors that affect supply. • Explain how firms choose a location to produce goods.
Introduction • Several factors cause the supply curve to shift.
Any changes in the cost of an input (natural resources, land, labor, capital) used to make a good will affect supply. A rise in the cost of raw materials, for example, will result in a decrease in supply because the good has become more expensive to produce. Input Costs The high input costs that dairy farmers pay for feed, labor, and fuel result in higher prices for milk and other dairy products.
Rising Costs and Technology • If the cost of resources go up, producers will make fewer goods because they are more expensive to make. • Cut production to lower marginal cost. • Advances in technology can lower production costs, shifting the supply curve to the right. • Automation • Computers • E-mail
Government’s Influence • In addition to input costs, the federal government also has the power to affect the supplies of many types of good. • Regulation is when a government make s rules that affect the production of a good or service. • Product Safety • Pollution • Lead-free Gasoline • Regulations raise the cost of producing goods, causing the supply curve to shift to the left.
Government’s Influence • Businesses view taxes as an added cost of producing goods and services, making it more expensive to produce goods and services. As a result, the supply curve shifts left. • An excise tax is a tax on the creation or sale of a product. • Cigarettes • Alcohol
Government’s Influence • Subsidies • The government often gives subsidies to the producers of a good. • Subsidies generally lower cost, which allows a firm to produce more goods. • Reasons for subsidizing products include: • To provide for people during food shortages • To protect young industries from foreign competition.
Non-Price Influences – Changes in the Global Economy • Since many goods and services are imported, changes in other countries can affect the supply of those goods. • An increase in wages in one country or the increased supply of a good in another will cause the overall supply curve to shift. • Restrictions on imports also affect supply.
Shifts in the Supply Curve • Factors that reduce supply shift the supply curve to the left, while factors that increase supply move the supply curve to the right.
Future Expectations of Prices • If a seller expects the price of a good to rise in the future, the seller will store the goods now in order to sell more in the future. • If the prices of good is expected to drop in the near future, sellers will earn more by placing goods on the market immediately, before the price falls.
Number of Suppliers • If more suppliers enter a market, the market supply will rise and the supply curve will shift to the right. • If suppliers stop producing a good and leave the market, market supply will decline, causing the supply curve to shift to the left.
Where do Firms Produce? • A key factor in where a firm will locate is transportation. • When inputs such as raw materials are expensive to transport, a firm will locate close to the inputs. • When outputs (the final product) are more costly to transport, firms will locate close to the consumer.
Review • Why does the supply curve shift? • What is a subsidy, and how do subsidies affect the supply curve? • What is an excise tax, and how do excise taxes affect the supply curve? • What effect do regulations have on the supply curve?