Download
1 / 24
240 likes | 265 Vues
This PowerPoint presentation provides an overview of the cardiovascular system, including its purposes, components, and functions. It also covers topics like arterial blood pressure, electrical activity of the heart, cardiac output, and circulatory responses to exercise. Suitable for PSE 4UI students.

E N D
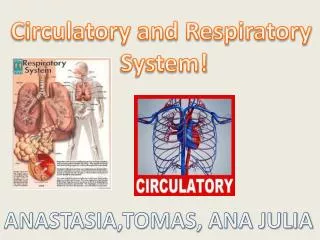
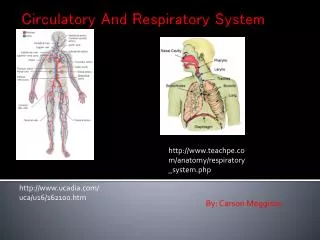
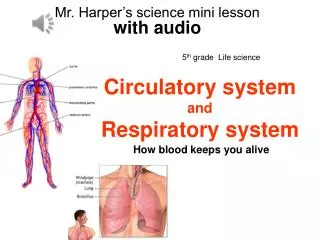
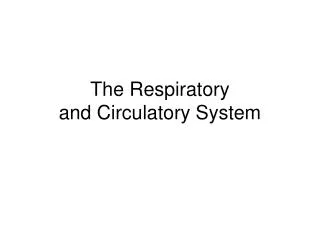
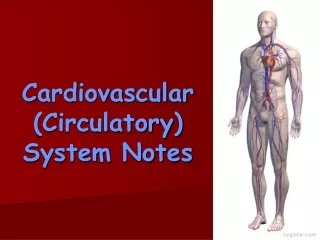
Cardiovascular System PowerPoint Presentation Circulatory and Respiratory Unit PSE 4UI
Purposes of the Cardiovascular System • To provide a constant supply of oxygen and glucose to the body • To maintain homeostasis by transferring heat energy • To remove wastes and prevent infection by means of clotting
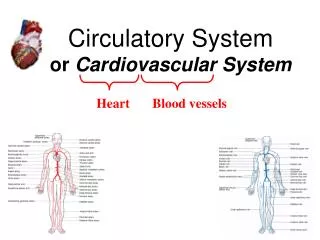
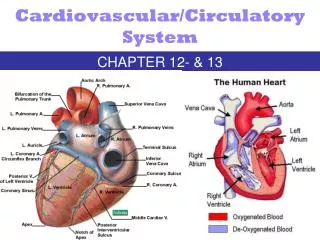
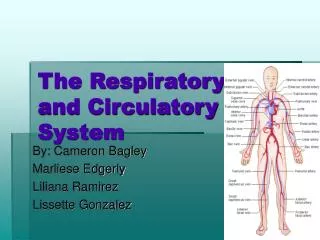
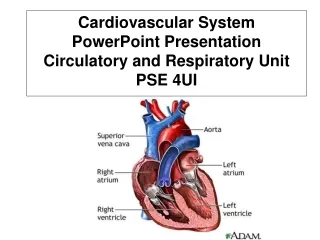
2. Components: • Heart: The pump which sends the blood to the lungs and the body • Vessels: Arteries, capillaries and veins transport blood to various • parts of the body • c. Blood: Composed of red and white blood cells, platelets and plasma
3. Systemic System • Systemic Circuit • Left side of heart • Blood is sent to inferior/ superior aspects of body under high pressure • Returns deoxygenated blood to right heart via veins • Pulmonary Circuit • Right side of heart • Deoxygenated blood is sent to the lungs under high pressure • Oxygenated blood returns to left atrium via pulmonary vein
4. Cardiac Cycle • Systole • The contraction of the heart (pumping action) • Electrical and mechanical changes • Stimulus from sino-atrial node • E.g. blood volume changes • Diastole • The relaxation or filling of the heart muscle • Takes twice as long as systole • Pump needs to be “primed” • Systole = 0.3 s • Lowest blood pressure in body
5. Arterial Blood Pressure Expressed as systolic diastolic Normal – 120 mm Hg High – 80 mm Hg Systolic pressure (top number) -this is the pump phase of the heart or the highest pressure of within the blood vessels Diastolic pressure -this is the filling stage of the heart or the lowest pressure
6. Blood Pressure • Pulse Pressure (PP) • Difference • PP = Systolic - Diastolic • Mean Arterial Pressure ( MAP ) • Average • MAP = Diastolic + 1/3(Systolic –Diastolic)
7. Sedintery Lifestyle/Stress Chemical Influence Stimulants (ie. Caffeine, etc.) Age Male/Female Body Position Physical Limitations (ie. Arteriosclerosis/Atherosclerosis)
8. Causes of High Blood Pressure • Age • Race • Heredity • Diet • Stress • Inactivity
9. Electrical Activity of the Heart • Contraction of heart depends on electrical stimulation of myocardium • The sino-atrial node (SA node) or the pacemaker will heart to contract 70-80 times per minute • The atrio ventricular node (AV node) will transfer that initial electrical impulse to the muscular walls of the ventricles
Atrial Stimulation Pathway 10. Internodal Pathways Atrioventricular Node Bundle of His Right and Left Bundle Branches Purkinje fibres • Electrocardiogram (EKG) • Records electrical activity of the heart • P wave • Atrial depolarization • QRS complex • Ventricular depolarization • T wave • Ventricular repolarization
11. Cardiac Output (Q) • Q = Cardiac Output or Q = fH x Vs • Where: • Q = Heart Rate x Stroke Volume • fH = Heart Rate • Vs = Stroke Volume
12. Cardiac Output: the amount of blood that is pumped out of the left ventricle in one minute (L/min) Range of normal at rest is 5-6 L/min During aerobic activity 20 L/min Max. Q is greater than 30 L/min
13. Heart Rate: the number of times that the heart contracts in a minute • Range of normal at rest is 60 – 80 beats/min • Increases in Max. 220 – Age (Submaximal heart rate) • Medications or upper body exercise can incrementally increase heart rate
14. Stroke Volume the amount of blood that is ejected from the left atrium in a single beat Range of normal at rest is affected by exercise During exercise, stroke volume increases depending on the intensity of the activity Max. SV is 180 ml Increased SV during rhythmic aerobic exercise is due to increased aerobic demand
15. Frank Starling Law of the Heart • The heart will pump and stretch at a rate that will allow it to increase the strength of the contraction
16. Components of Blood • Plasma (55% of blood) • 90 % water • 7% plasma proteins (3% other (acids and salts) • Cells • Red blood cells (RBC) or erythrocytes • White Blood Cells WBC) or leukocytes • Platelets • Fibrinogen protein used for clotting purposes • Hematocrit • Part of hemoglobin complex which is used to transport oxygen
17. Oxygen Delivery During Exercise • Oxygen demand by muscles during exercise is determined by carbon dioxide concentration in blood • Increased oxygen delivery accomplished by: • Increased cardiac output • Improved delivery of oxygen (VO2 max)
18. Circulatory Responses to Exercise, Heart Rate and Blood Pressure • Depend on: • Intensity of activity • Duration of activity • Ability of body to remove fatigue products such as lactic acid
19. Transition from rest> exercise and exercise> recovery • Rapid increase in initial respiratory rate • Plateau in aerobic capacity due to training effect. Most athletes use cross training to “fool” muscles • Recovery depends on: • Duration and Intensity • Ability to train and flush lactic acid
20. Incremental Exercise • Heart rate and cardiac output • Raises at an exponential rate • Stabilizes at a target heart rate • Systolic blood pressure • The heart does not need to pump as hard under submaximal conditions • Double product • Increases linearly with intensity and duration • Indicates the training level of the athlete • Double product = the athlete can train longer while applying higher levels of intensity
21. Arm vs Leg Workout at the same oxygen uptake arm work results in higher: • Heart rate • Heart rate increases due to the effect of gravity • Blood pressure will actually lower over time due to the training effect
22. Prolonged Exercise • Cardiac output is maintained • Through regular physical activity • (minimum 3 times a week/20-30 minute intervals) • Increasing levels of intensity to maximize training effect • Cardiovascular drift • This is caused due to dehydration and increased blood flow to the skin.