EUROWATERNET-Emissions
260 likes | 575 Vues
EUROWATERNET-Emissions. EEA - ETC Water / EIONET WORKSHOP Budapest, Hungary 11-12 th November 2004. Benoît FRIBOURG-BLANC Andre-Francois BOSCHET Bruno POIZAT. 1. D. Driving force. 5. R. Response. 4. 2. I. P. Pressure Emissions. Impact. 3. S. State.

EUROWATERNET-Emissions
E N D
Presentation Transcript
EUROWATERNET-Emissions EEA - ETC Water / EIONET WORKSHOP Budapest, Hungary 11-12th November 2004 Benoît FRIBOURG-BLANC Andre-Francois BOSCHET Bruno POIZAT
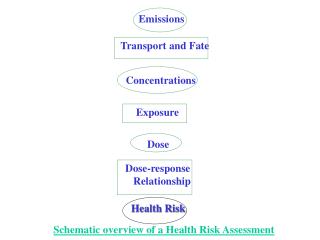
1 D Driving force 5 R Response 4 2 I P Pressure Emissions Impact 3 S State Development of pressure indicatorsthe DPSIR (adapted from Latvian Environment Agency 2002)
Development of pressure indicatorsData collection and organisation in EWN-e • Identification of the source: the Driving Force that generate the emission • Identification of the pollutants (determinands) • Identification of the geographical area • Use of a temporal aggregation : the year
Development of pressure indicatorsThe Use of EPER data for big industries Emissions to water of Total Nitrogen (threshold : 50 000 kg/year) Ni and compounds (threshold 2kg/year)
ORGANIC POLLUTION AND NUTRIENTS ATBE DE DK ES FI FR GR IE IT LU NL NO PT SE UK ATBE DE DK ES FI FR GR IE IT LU NL NO PT SE UK ATBE DE DK ES FI FR GR IE IT LU NL NO PT SE UK ATBE DE DK ES FI FR GR IE IT LU NL NO PT SE UK ATBE DE DK ES FI FR GR IE IT LU NL NO PT SE UK Development of pressure indicatorsThe Use of EPER data for big industries Number of emissions for 26 substances per group
Development of pressure indicatorsThe use of data collected from voluntary participants Nutrient data from Denmark, example on Total Nitrogen from urban, industrial, agriculture, and natural sources, in 1989 and 1999
Development of pressure indicatorsThe use of data collected Data from Eurostat, example on BOD from all sources in 1990
Development of pressure indicatorsThe use of data collected from voluntary participants Emissions of Urban Waste Water Treatment plants in the Tevere River basin per Italian region in 2002 for 5 determinands (172 WWTP, 69 agglomerations)
Database on emission factorsDefinition and objectives • An emission factor is the estimated average emission rate of a given pollutant for a given source, relative to units of activity. It can be expressed by a quantity or by a concentration. It is often derived from a thorough description and monitoring of case studies. • Objective of the project : to gather emission factors from various sources in an easy-to-use database. • Objective of the database : to give a reliable information to estimate emissions to water, for a given source and a given pollutant.
Context • One of the activities of the task 12 developed by the EEA was the organisation of dataflows for the development of indicators. A need to have access to methodologies for the estimation of emissions, similar to what have been developed for air, has been expressed. • Emission factors applied to available statistical or administrative data are used to give a proxy indication of the level of emission. • IOW proposed to develop a database of various emission factors in collaboration with voluntary partners.
Usefulness of the emission factor • An emission factor can be used to estimate the emission load for a small source or a source that is not regularly monitored. • Exemple : For a manufacture of dyes and pigments (NACE code : 24.12), 10,64 g of Zinc and compounds discharged per year and for 1000 kg of manufactured dyes and pigments, before urban treatment. - Industry characteristics similar - Production of 20 tons of dyes and pigments per year 20 x 10,64 = 212,8 g of Zinc discharged in waste waters per year.
Emission factor formula EF = Ec x CV With EF : Emission Factor Ec : Emission (in kg for example) CV : Characteristic Value, in a characteristic value unit (kg of finish product, for example) Example for an industry of printing on wool : EF = 1,33 kg of chromium per ton of textile dyed Ec CV
Information required • Pollutant source: Any type of source is welcome (industries, transports, household…diffuse or point sources). • Substance: associated with the CAS code. • Emission factor (average, maximum, minimum or median value, or a formula) associated to a unit, and a characteristic value. • Discharge step (raw or net pollution), and the type of treatment (industrial, urban, independent, or no treatment) • Information concerning the context of the emission factor: date of the measure, place precision, comments, application sector of the emission factor…
Organisation of the databasemain tables structure T_SUBSTANCES T_REFERENCES T_EMISSION FACTORS T_NACE POLLUTANT ACTIVITY T_POLLUTANT ACTIVITY (EWN classification) T_TEF POLLUTANT ACTIVITY T_NFR POLLUTANT ACTIVITY
Application • The aim of the database is to provide emission factors after a selection on one or two fields. • Possibility to have emission factors linked to : A SUBSTANCE AND A POLLUTANT ACTIVITY A SUBSTANCE A POLLUTANT ACTIVITY A NACE ACTIVITY A NFR ACTIVITY
Available data • Examples of emission factors given by Kees Baas (Statistics Netherlands) : • Household (NFR code : 6.B.2) : 4,285 kg of total Nitrogen are discharged per year and per inhabitant in the Netherlands, before urban treatment. • Manufacture of dyes and pigments (NACE code : 24.12) : 10,64 g of Zinc and compounds are discharged per year and for 1000 kg of manufactured dyes and pigments, before urban treatment.
Available data • Examples of emission factors given by Rudy Vannevel (Vlaamse Milieumaatschappij – Belgium) : • Metabolic household : 340 µg of Zinc per litre of waste water. This data is available for a waste water outflow of 136 l per day per inhabitant. • Traffic (main regional roads) : 1,731 kg of Cadmium per ha of road
Available dataNovember 2004 • 16 500 emission factors provided by partners. In the database: • 5 700 emission factors (10 800 to be included after processing). • 131 substances. • 87 references.
Database operation • First step: choose a search type :
Database operation • Then, choose a substance : • And a pollutant source :
Resultspart « emission factor » Several results
Several references Resultspart « references »
Conclusion • Progress with the pressure indicators: • A continuous need for more data and new volunteers, • A close link with spatial analysis, • Can start very easily from a small dataset and extend the coverage afterwards • Progress with the emission factors database: • Data gathered into a unique database. • Easy to use product, no need to know how Microsoft Access works. • A data dictionary, a notice for the use. • Future developments: • more data, • Selection of emission factors by other ways: discharge step, characteristic value…