Evaluating NOx Chemistry in CMAQ Using Remote Sensing: Insights from DISCOVER-AQ
150 likes | 286 Vues
This presentation by Russ Dickerson at the University of Maryland discusses the evaluation of nitrogen oxides (NOx) chemistry using the Community Multiscale Air Quality (CMAQ) model alongside data from remote sensing tools like OMI and DISCOVER-AQ. Key findings include trends in NO2 concentrations across urban and rural areas, significant decreases in emissions post-SIP call, and insights into air quality patterns. The GRIPS (Geostationary Remote Infrared Pollution Sounder) is highlighted for its potential in discerning emission sources and measuring greenhouse gases over the Asian continent.

Evaluating NOx Chemistry in CMAQ Using Remote Sensing: Insights from DISCOVER-AQ
E N D
Presentation Transcript
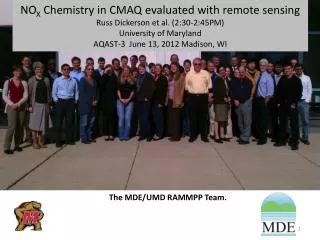
NOX Chemistry in CMAQ evaluated with remote sensingRuss Dickerson et al. (2:30-2:45PM)University of MarylandAQAST-3 June 13, 2012 Madison, WI The MDE/UMD RAMMPP Team.
Outline • NO2 from OMI, DISCOVER-AQ and CMAQ • Concentrations & Trends • Urban/rural • Profiles • GRIPS: Geostationary Remote Infrared Pollution Sounder • Am Chem Soc MARM meeting session May 2012.
DISCOVER AQ Ground, model, air and satellite comparisons at a single location Slide prepared by Clare Flynn, UMD PhD Candidate, AOSC
CEMS Emission (point sources) Trends NOx NOx: Large decrease after SIP call in 2003; OH/PA/WV only scrub NOx during ozone season until January 2009; further decrease for all states after 2009. Hao He.
End summer only controls Thanks T. Canty
0.25o x 0.25o CMAQ 4.7.1 DOMINO v2 (OMI Satellite Obs.) Tropospheric Column • AQ SIP modeling • July 2007 • Recent (n-1) version of CMAQ 4.7.1 • Considers 2007 emissions/met. Fields • DOMINO v2 satellite retrieval • Model – lower than satellite in rural areas??? • higher than satellite in urban regions • Major Policy Implication; lightnig not enough • (T. Canty)
Aircraft (UMD Cessna) data provide both regional information and vertical structure of pollutants Altitude (km) NO2 (ppbv) AM data / upwind / rural PM data / downwind / urban Thanks J. Stehr, L. Brent
Papers Pending • Profiles of NO2from DISCOVER-AQ, Brent et al. • Emissions fingerprints for Asia, North America…. Streets et al., • CMAQ vs. observed NO2 profiles, Canty et al., • GASP observations and PM2.5, Stehr et al.
GRIPS Quad – Telescope DesignThree Pressure Levels SideView Filter Optics Gas Cell Empty Cell Optics Detectors Optics Front View Filter P=0 Optics P=P1 P=P2 Gas cells with pressures P1, P2, P3 and 0. P=P3 M. Schoeberl
GRIPS External Multi-Telescope Design Top View Quad telescope bundles CH4: 2.28 µm CO: 2.33 µm 2.5 ft N2O: 3.88 µm O2: 0.76 µm 1.5 ft 2.3 ft Gimbal Gimbal CO: 4.64 µm CO2: 2.05 µm
GRIPSGeostationary Remote Infrared Pollution Sounder Carbon Monoxide from GEO Methane from GEO Ratios of trace gases provide unique fingerprints that can help us identify emission sources. GRIPS can distinguish pollution sources using CO2 / CO and CO2 / CH4 ratios. Augmenting GRIPS with data from a UV/Vis spectrometer such as GEMS will allow further categorization. For example, with SO2 and NO2 measurements we can further distinguish sources. Emission Ratios 104 GRIPS 103 GRIPS Fingerprints, Asia GRIPS + GEMS CO2 / CO 102 10 1 Power Vehicle Biomass Industry Residential
Thank You Conclusions NO2 Concentrations from OMI are in reasonable agreement with aircraft columns and Pandora. Both remote and in situ observations reflect impressive downward trends. The urban/rural ratio is smaller in observations than in CMAQ. Emissions can be evaluated with proposed remote sensing instruments.
GRIPSGeostationary Remote Infrared Pollution Sounder Instrument Overview GRIPS employs the well-tested gas filter correlation radiometry (GFCR) technique, used successfully by HALOE, MOPITT, and other satellite instruments. Solar reflected and thermal IR radiation is filtered through gas-cells at different pressures. The gas filters provide superior spectral resolution, and can separate the signature of the measurement gas at different altitudes (see figure below). GRIPS will provide boundary layer, mid-tropospheric, and total column concentrations of CO, CO2 and CH4 over the entire Asian continent with 8 km nadir resolution. To measure each species, light is collected by a 4-telescope bundle hosting gas cells at different pressures. The 4 beams are focused on a cooled HgCdTe detector array. One bundle each is used for CH4, CO2, N2O and O2. CO requires two bundles. The O2 and N2O measurements are for mitigating effects of aerosols, clouds and surface pressure variations. The bundles can be configured to fit the available space, and one possible configuration is shown here on the pointing gimbal 45 cm GRIPS Instrument Mass: 38 kg Power: 23 W Data Rate: 5 Mb/s Volume: 0.13 m3